
Colorado Cannabis Market:
2014–2026 Performance Review
Market Size and Annual Revenue Trajectory
Colorado opened the world's first legal recreational cannabis stores on January 1, 2014, building on a medical program that had already been operating for several years. Unlike markets where adult use launches into an immature medical channel, Colorado's medical program was an established $380M-a-year business the month adult use began — the two channels effectively coexisted from day one rather than one displacing the other over time.
Total revenue grew every year from 2014 through 2021, crossing $2B annually in 2020 and peaking at $2.24B in 2021. Colorado has now recorded four consecutive years of decline (2022–2025), with total revenue falling to $1.32B in 2025 — a 41% contraction from the 2021 peak. Revenue through the first half of 2026 ($633.5M across six months, running at roughly $105.6M/month) suggests the decline is decelerating but not reversing. Four consecutive years of decline is a long correction by any standard, and the first-half 2026 data (Table 1) shows no clear sign yet of the market finding a floor.
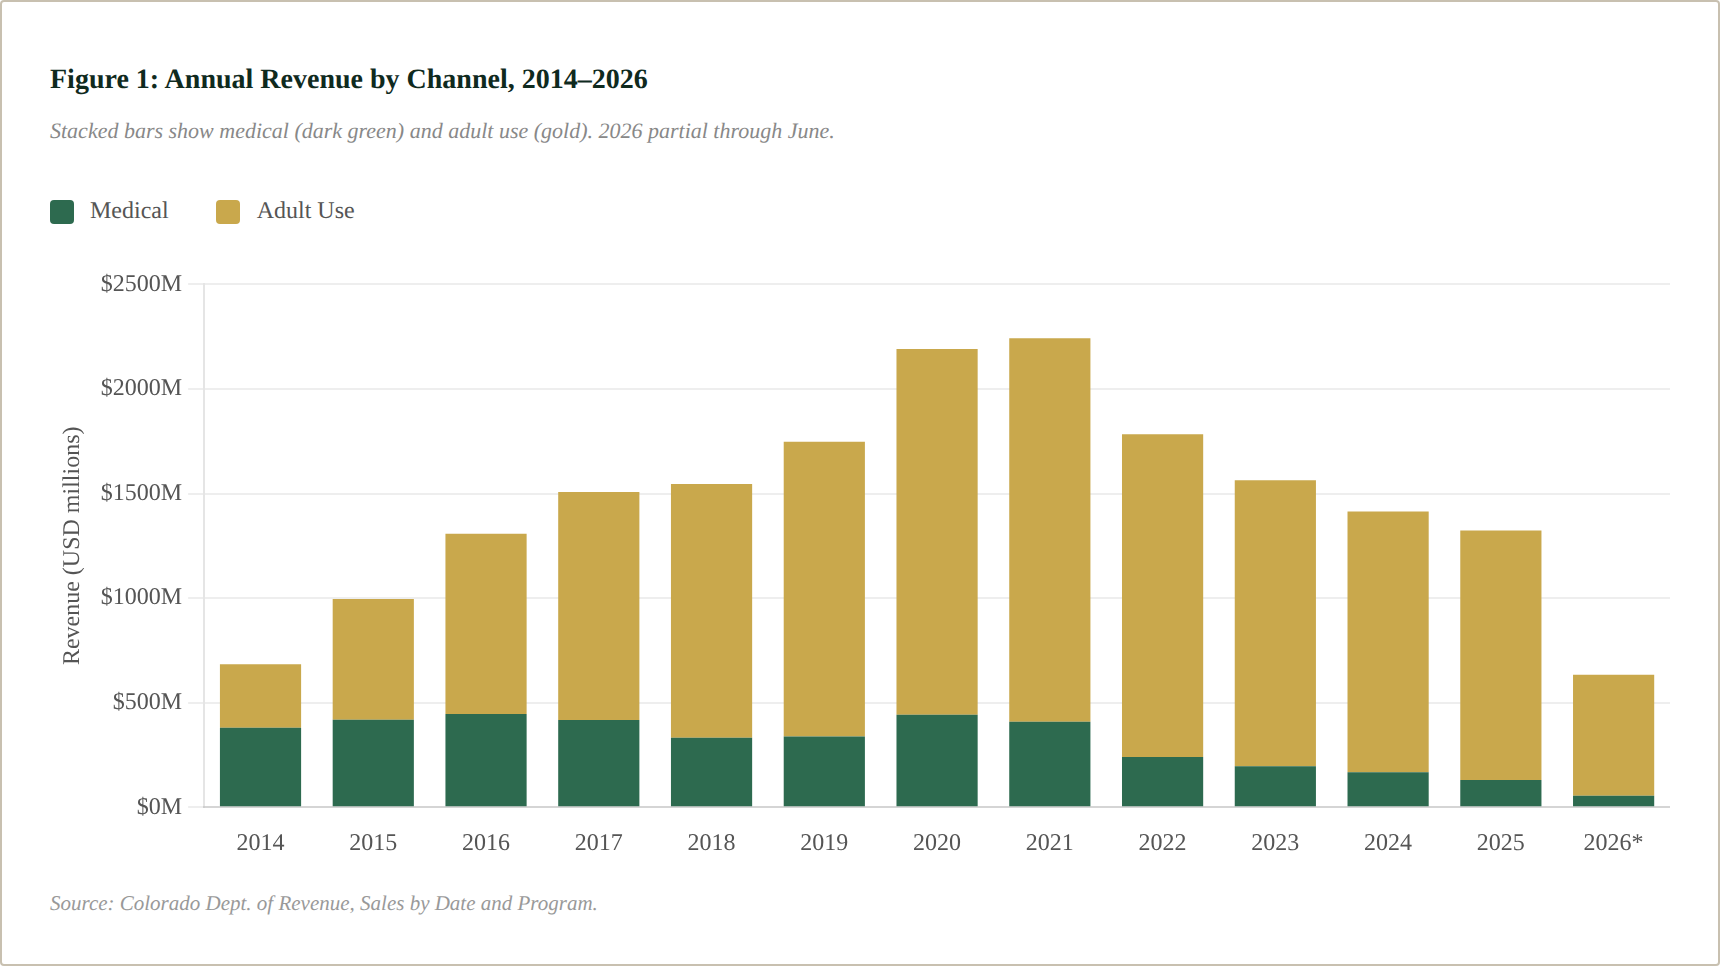
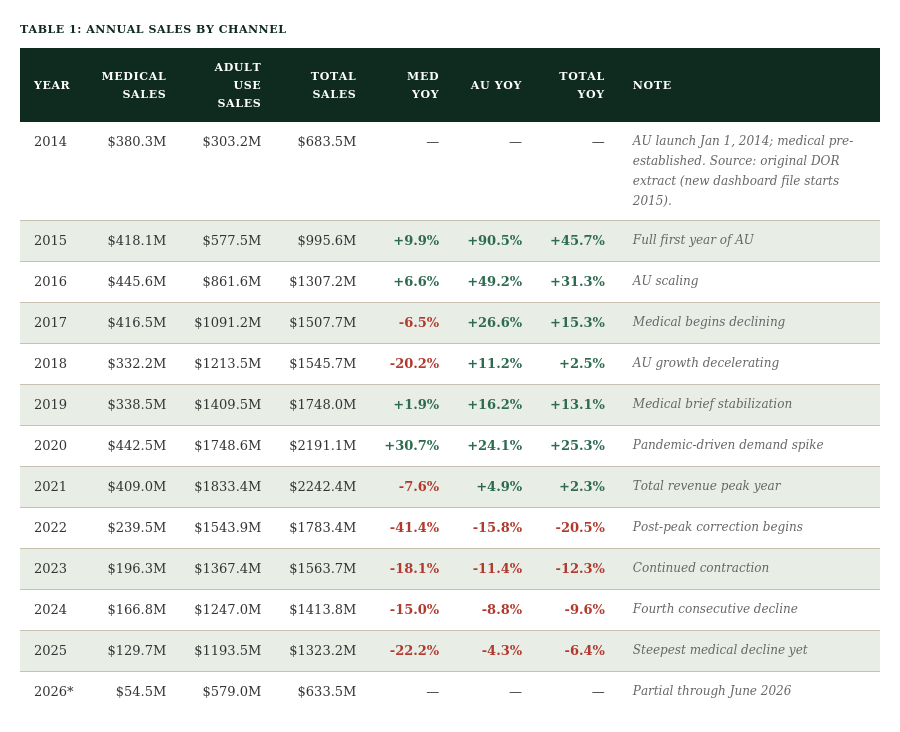
* 2026 data partial through June 2026. All figures in USD. 2014 figures sourced from the original DOR extract; 2015–2026 figures sourced from the state's public Tableau dashboard export, which revises 2021–2025 slightly upward (see Data Sources note) relative to the original extract.
Medical and Adult Use: A Diverging Trajectory
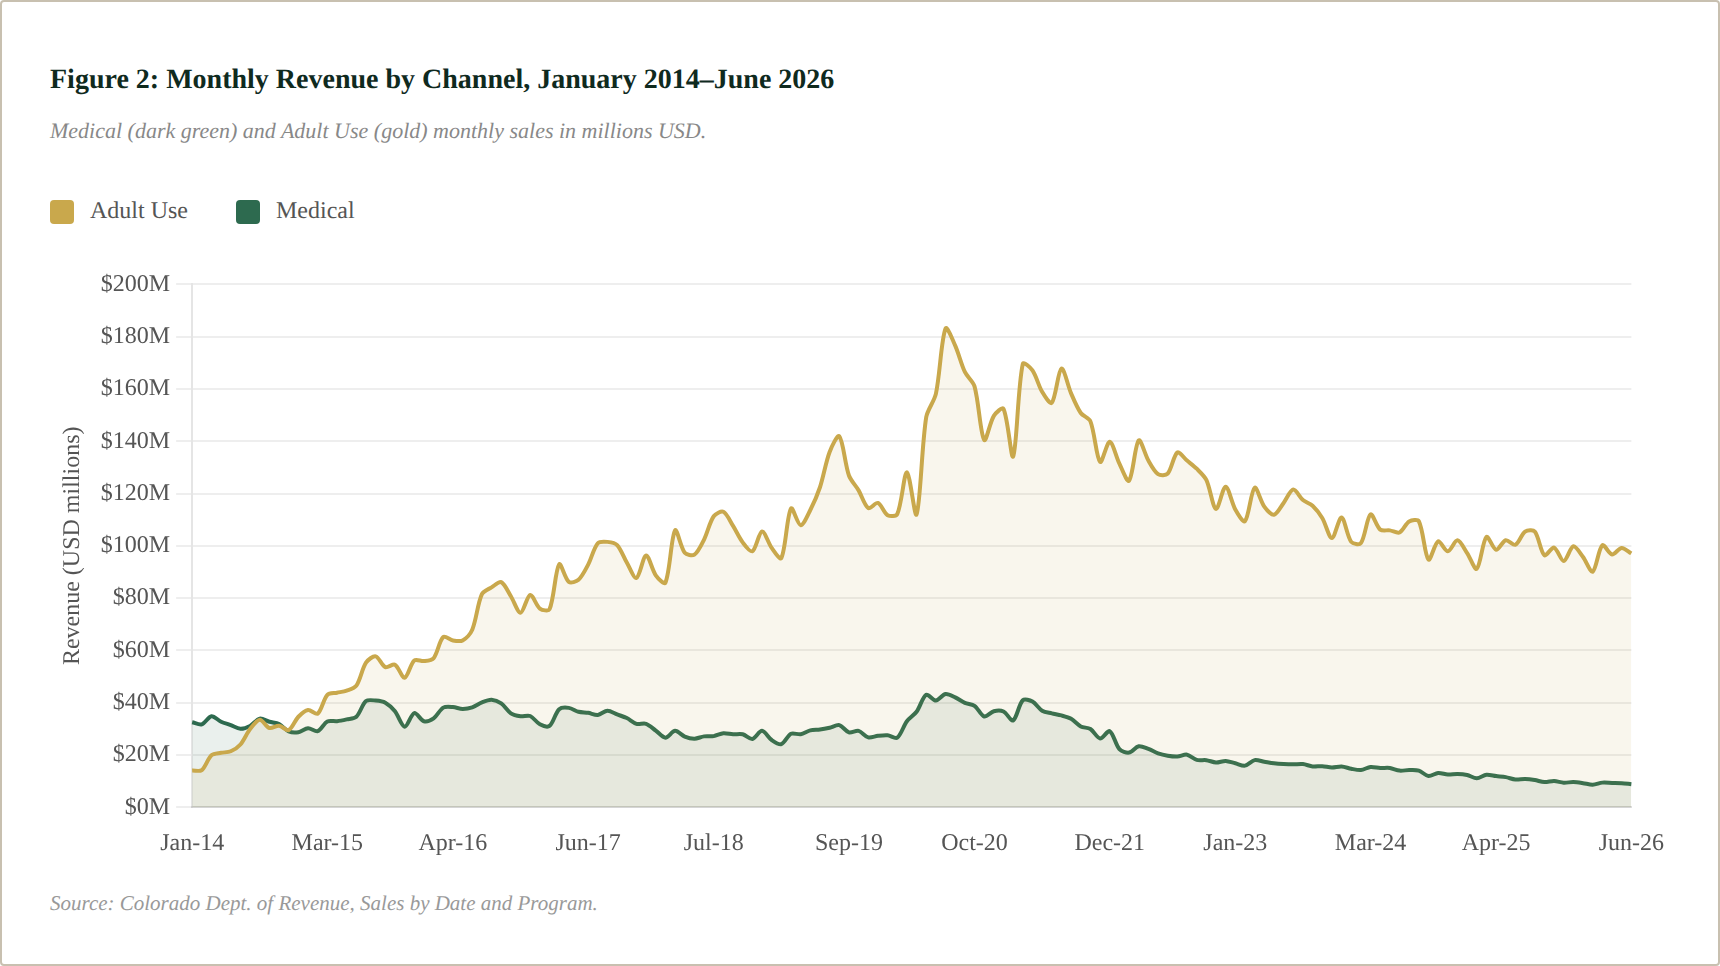
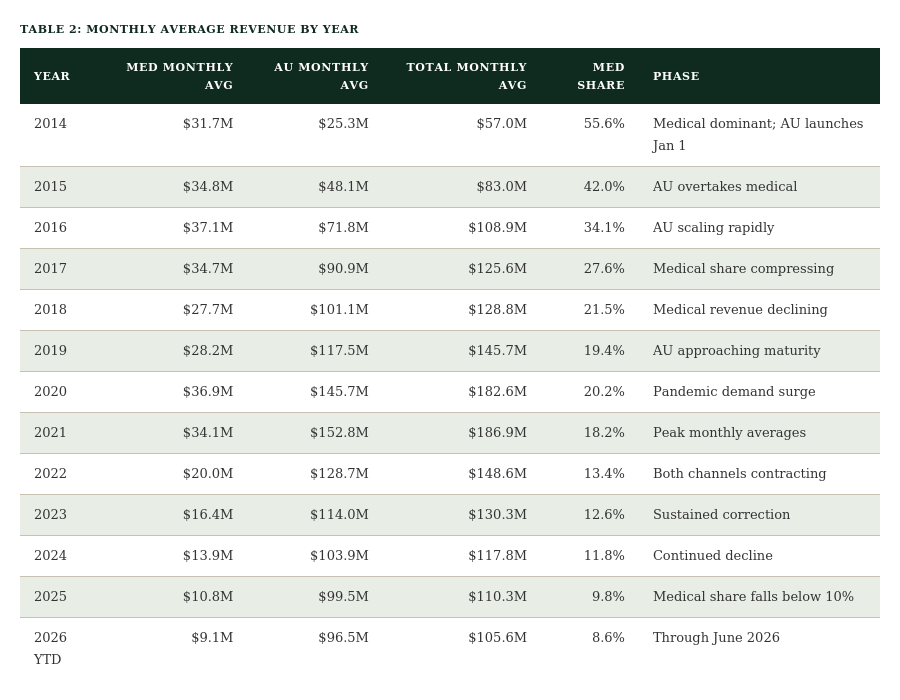
Colorado's channel dynamics differ structurally from newer legalization states. Medical was the dominant channel through 2014 — 55.6% of monthly revenue — but adult use overtook it within about a year. By 2025, medical represented just 9.8% of monthly revenue, down from 55.6% a decade earlier, and has fallen further to 8.6% through the first half of 2026. In some legalization states, medical revenue continues growing for a period after adult-use launch, particularly where the medical program is still young. Colorado's medical channel didn't have that runway: because medical and adult-use served an overlapping consumer base from day one, medical began losing share almost immediately once recreational stores opened.
Colorado's early growth also benefited from an outsized tourism effect that has faded as neighboring states opened their own markets. As one of only two states with legal recreational sales starting in 2014, Colorado drew heavily on out-of-state demand: a 2014 state analysis found that roughly 90% of recreational sales in Colorado's mountain resort towns came from out-of-state visitors, and dispensaries in border towns reported similarly high shares of out-of-state customers. That advantage narrowed as nearby states legalized their own recreational markets -- Arizona in 2021 and New Mexico in 2022 -- reducing the incentive for cross-border buyers to make the trip. Colorado's own legislative fiscal analysts have pointed to slowing cannabis-tourism demand from newly-legal neighboring states as a contributing factor in the state's declining tax revenue, alongside oversupply and a post-pandemic pullback in consumption. The timing lines up with the market's own trajectory: Colorado's revenue peaked in 2021, the same year Arizona's recreational market opened, with New Mexico following about a year later.
Washington offers the clearest peer comparison for Colorado's trajectory — both are original 2012-legalization states with no ownership-cap-driven consolidation ceiling, and both peaked in 2021 before entering sustained decline. Washington's total cannabis sales peaked at roughly $1.47B in 2021 and had fallen to approximately $1.14B by 2025 — a 22% decline, comparable in shape to Colorado's 41% drop from its own 2021 peak, though Colorado's contraction has been considerably steeper. Washington's decline is attributed to many of the same forces reshaping Colorado: chronic oversupply (licensed THC production nearly tripled between 2017 and 2023 while sales roughly doubled), and margin compression from the nation's highest cannabis excise tax (37%) combined with the federal Section 280E tax burden that applies in both states. One structural difference is worth noting: Washington's regulatory system never maintained Colorado's separate medical/adult-use sales tracking at the same granularity, so channel-level comparisons are less exact — the comparison here is best read at the total-market level.
Patient Enrollment: A Single, Volatile Measure
Colorado's registry data provides one primary metric — monthly active registered medical patients — rather than the dual cumulative-approval-vs-active-use split available in some other states. This is itself a data-availability note worth flagging: a cumulative lifetime-approval figure -- the kind some state medical registries track separately from active-patient counts -- was not present in the provided source file, so this section tracks active registrants only.
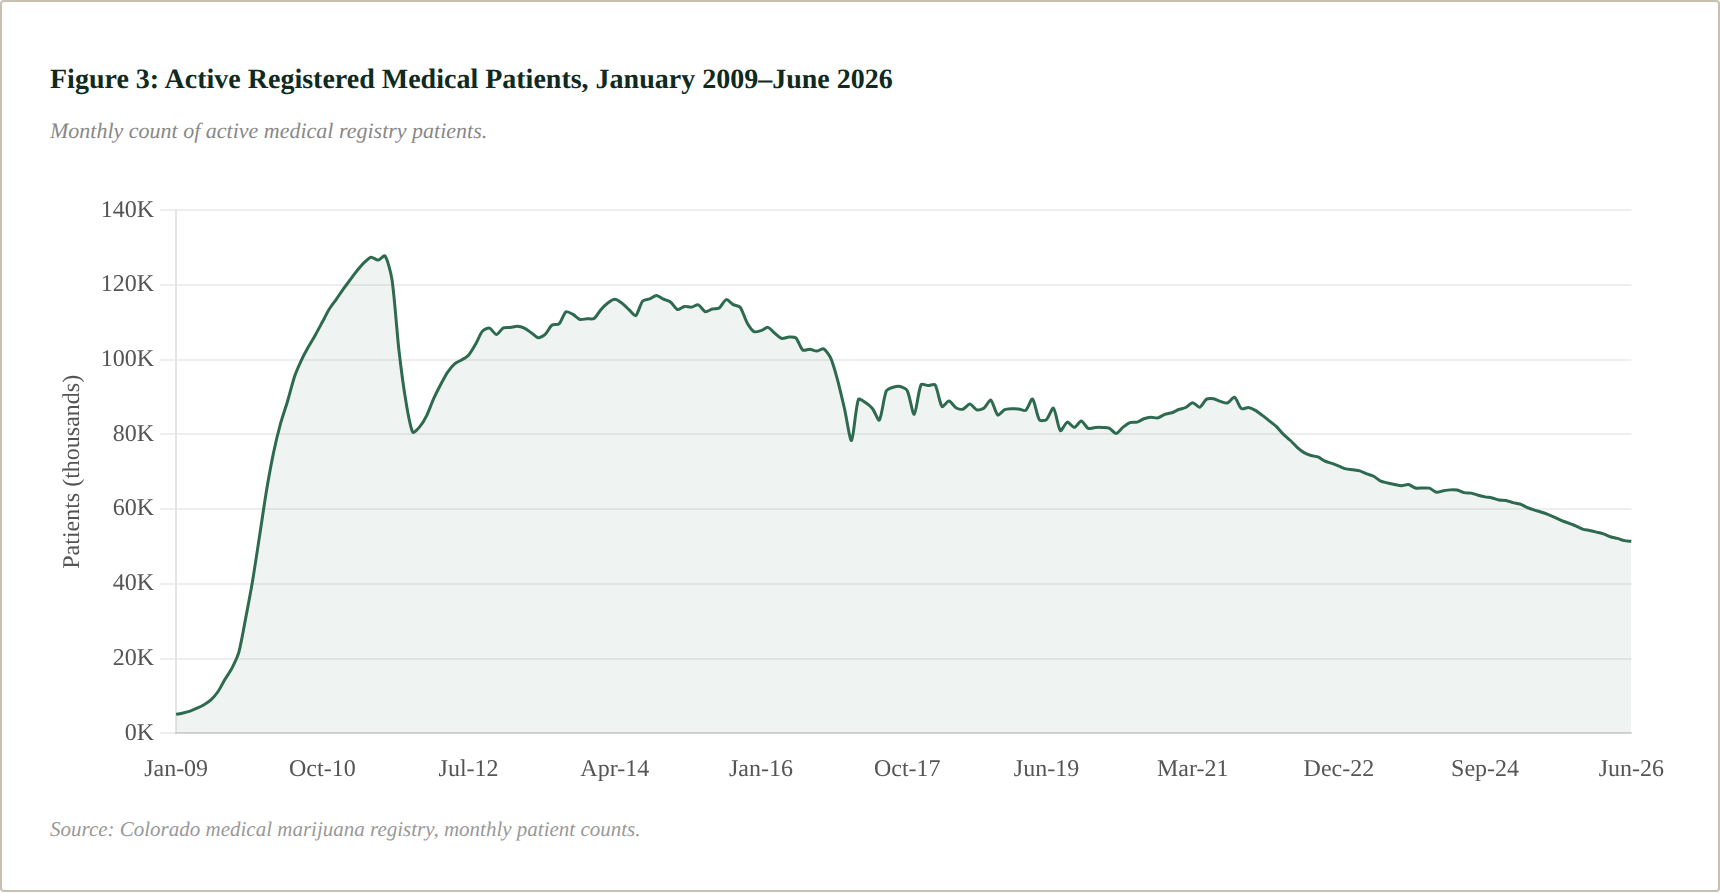
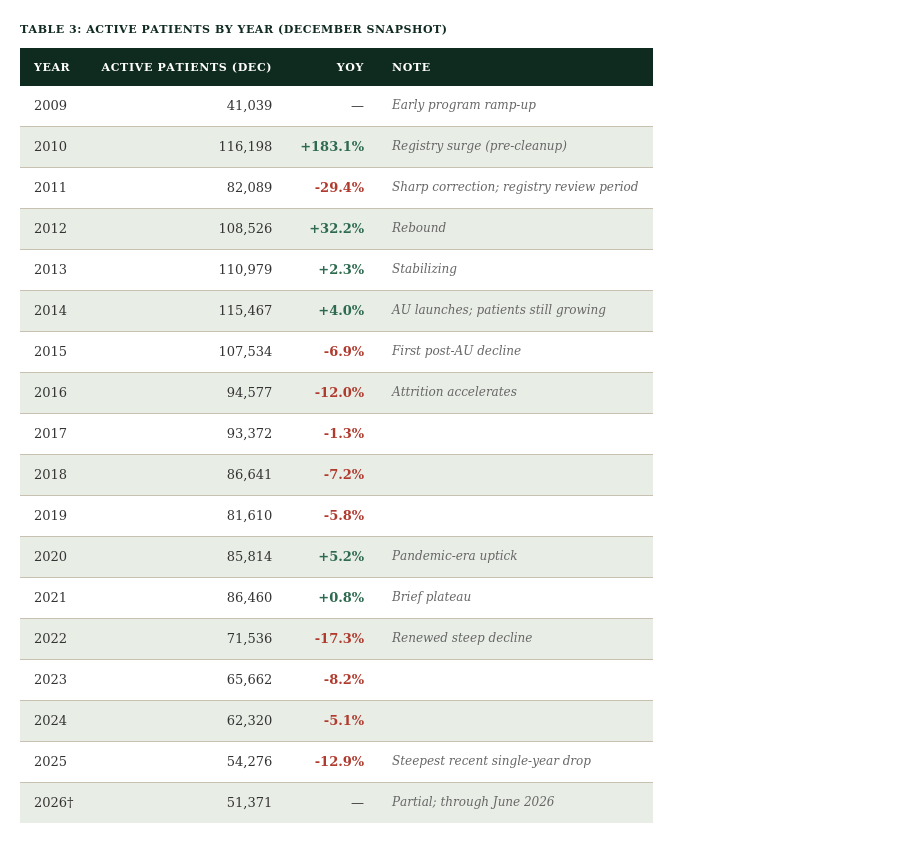
The early registry (2009–2012) was highly volatile: active patients grew from roughly 5,000 in early 2009 to a peak of 127,816 in July 2011, then fell sharply to under 81,000 by late 2012 — a swing that reflects the program's chaotic early years rather than a genuine shift in underlying demand, and predates any of the market and revenue data in this report. From 2014 (adult-use launch) onward, the pattern is more legible: active patients stood at 115,467 in December 2014 and have declined in most years since, reaching ~51,400 by June 2026 — a 55% decline from the 2014 level, and a 60% decline from the 2011 all-time peak.
Retail Expansion and the Licensing Structure
Store-count data covers May 2020 through June 2026, sourced from Emerald Intel. Colorado's active retail store count grew from 734 in May 2020 to a peak of 841 in mid-2022, before contracting to 757 by June 2026 — a modest net decline (-10%) that is far less pronounced than the store count's revenue backdrop would suggest, since Colorado's per-store economics have been compressing for longer.
Colorado's licensing structure has one notable feature: there is no statewide per-entity dispensary ownership cap — a 2018 reform (HB18-1011) repealed the prior limits on out-of-state investors and opened licensing to publicly traded entities, and vertical integration (single ownership across cultivation, manufacturing, and retail) is common and in some cases encouraged by the Marijuana Enforcement Division. Instead, license-count control in Colorado happens primarily at the local level: cities and counties opt in or out of allowing marijuana businesses altogether, and some jurisdictions — Colorado Springs among them — have frozen new license issuance entirely, capping location counts locally rather than through a statewide ownership formula. The result is a market with more dispensaries per capita than almost any other state, and consolidation pressure (see the Native Roots acquisition in Section 7) that plays out through open-market M&A rather than through a statewide ownership ceiling.
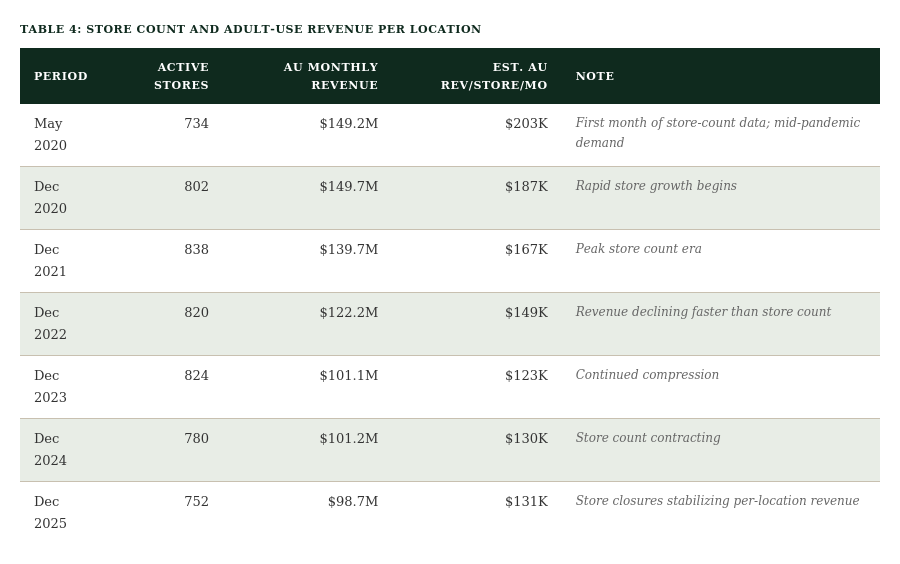
Store count source covers May 2020–Jun 2026 only. Revenue-per-store figures use adult-use revenue only; total active store count includes both medical and adult-use licensed dispensary locations; it does not include cultivation, manufacturing, or testing facility licenses.
Revenue per store fell from roughly $203K/month in May 2020 to approximately $131K/month by December 2025 — a decline of about 35%. That decline is comparatively moderate, largely because Colorado's per-store baseline was already much lower in 2020: with more stores per capita from the start (a legacy of the state's early and largely uncapped licensing approach), Colorado dispensaries never saw the extreme early-market revenue concentration that some newer-legalization markets experienced in their first one to two years.
Product Mix and Revenue Composition
Colorado's product-level data, sourced from the state's public dashboard, is available in two windows: an annual series covering 2018-2023 and a monthly series covering October 2025-June 2026, with a gap in between (2024 through September 2025) not present in either source. Both windows report category-share percentages rather than dollar figures directly; dollar values throughout this section were derived by applying each period's channel-specific (medical/adult-use) category shares to that period's actual revenue from Section 1. (The 2018-2023 dates were corrected from a corrupted year field in the source export and validated against CO_Product.xlsx's independent totals -- see Data Sources.)
The long-run trend shows a clear, gradual structural shift: flower's share fell from 50.1% of revenue in 2018 to 42.5% in 2023, while concentrate rose from 30.1% to 37.4% over the same span. That trend continued past the 2023 endpoint of the annual series and, by the time the monthly window picks back up in October 2025, concentrate (41.3%) has overtaken flower (38.6%) entirely -- a crossover this longer history shows was years in the making rather than a sudden 2025 shift. Edibles held a fairly narrow 12-15% range across both windows, and shake/trim stayed close to 5% throughout.
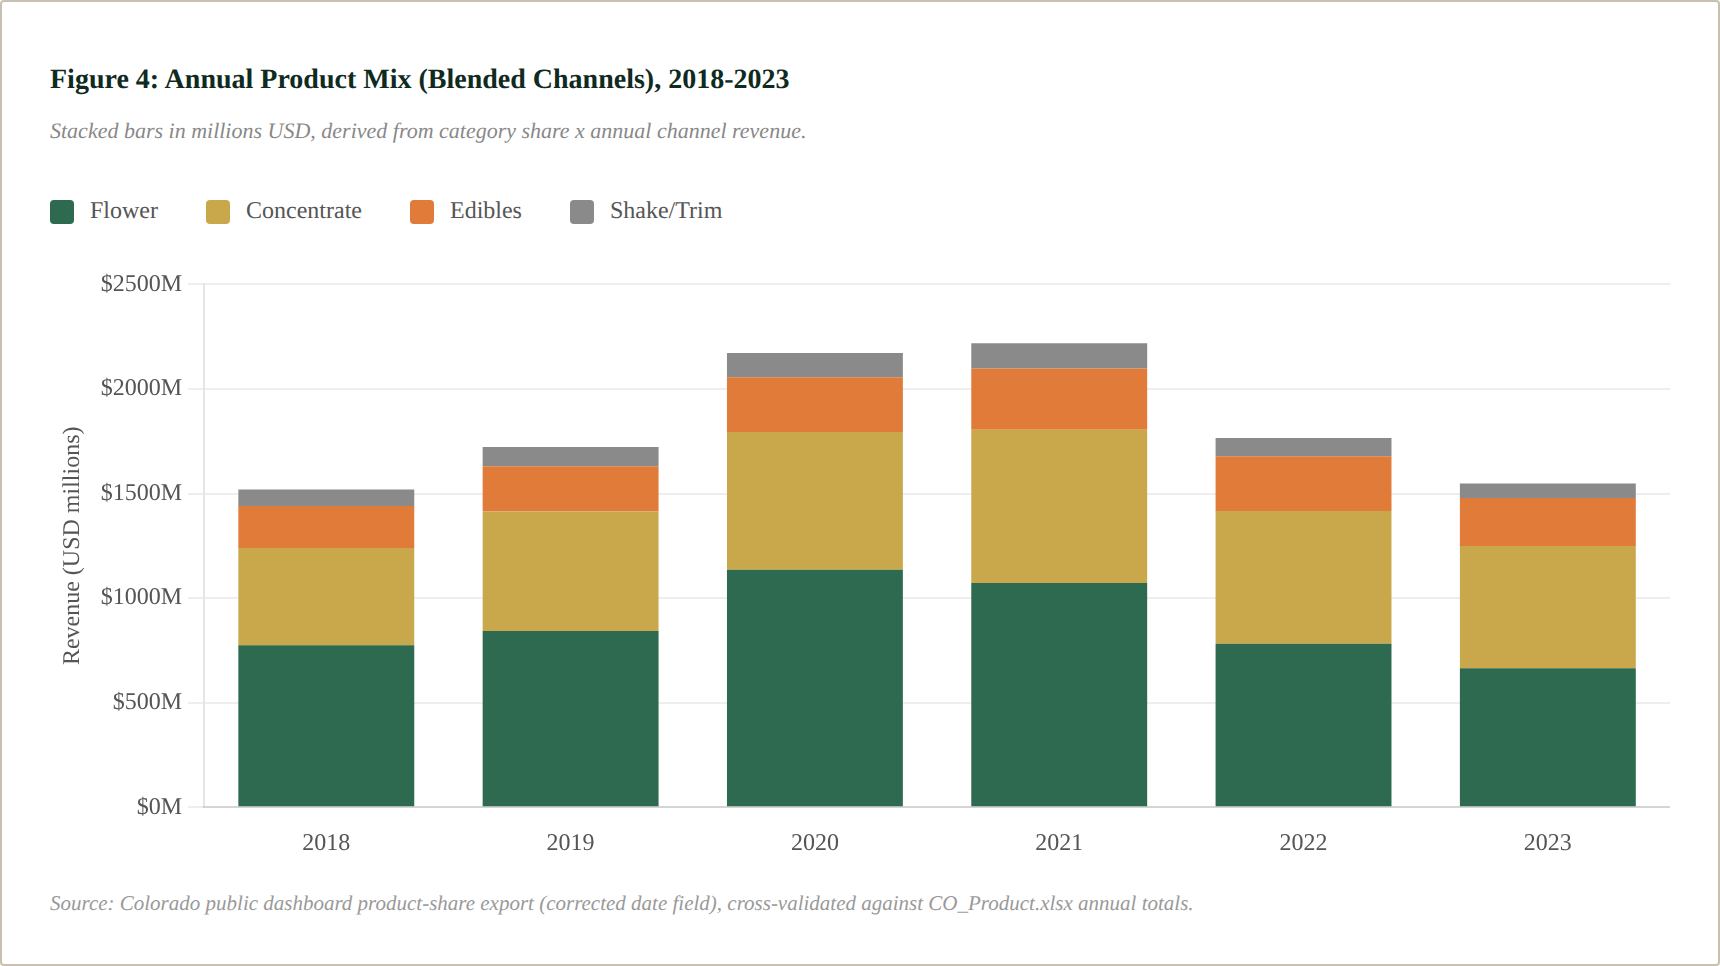
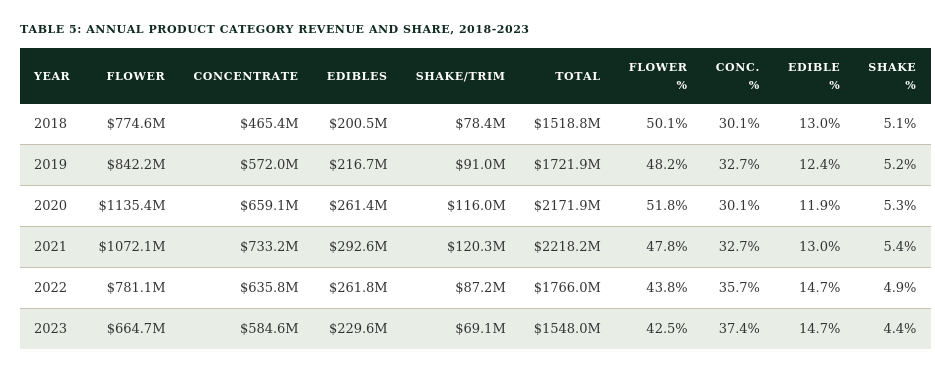
Annual totals derived from category shares x Section 1 revenue; shares capture ~98-99% of revenue per year, so totals run slightly below actual (see Data Sources).
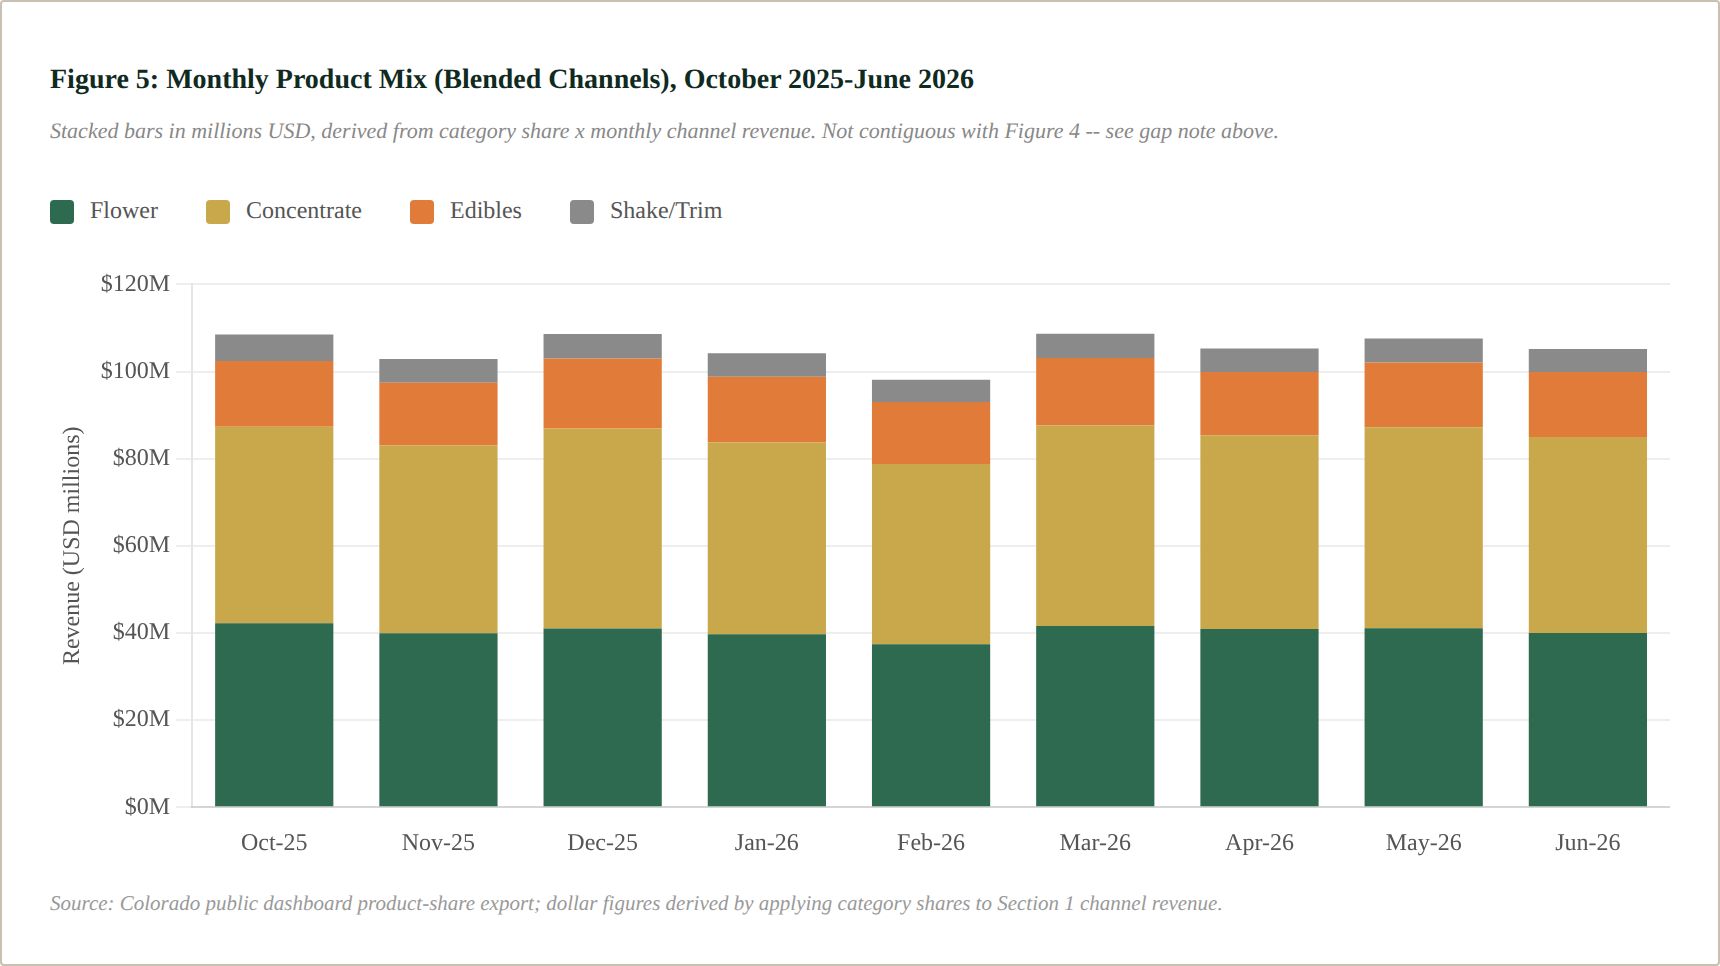
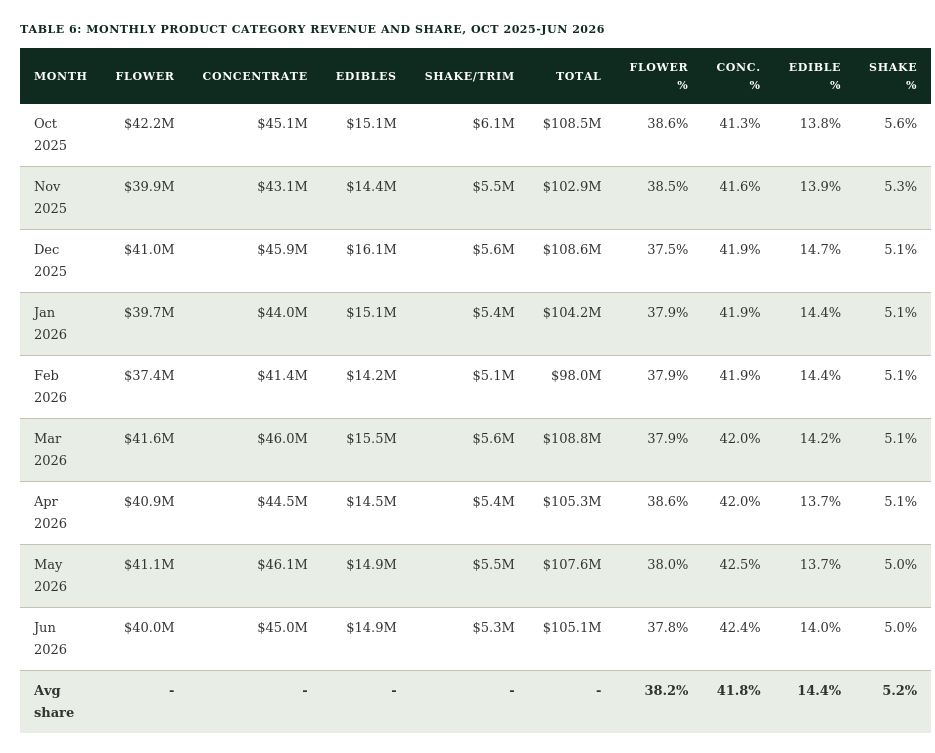
Within the recent monthly window, category shares are stable -- concentrate holding 41-43%, flower 37-39%, edibles 14-15%, and shake/trim about 5% -- consistent with a market that finished its structural product-mix shift and has settled into a new equilibrium, rather than one still actively transitioning.
Conclusions: What the Colorado Data Tells Us
Colorado's rise -- and its slowdown -- were both partly a tourism story
Colorado's early growth (monthly average revenue rose from $57M in 2014 to $187M by 2021) was propelled in part by a first-mover tourism advantage: state data from 2014 found roughly 90% of recreational sales in mountain resort towns came from out-of-state visitors, and border-town dispensaries reported similarly high shares. That advantage narrowed as neighboring states opened competing markets -- Arizona in 2021, New Mexico in 2022 -- a timeline that lines up closely with Colorado's own 2021 revenue peak and the four-year correction that has followed. Colorado's own legislative fiscal analysts have identified fading cannabis tourism as a contributing factor in the state's declining revenue, alongside oversupply and softer post-pandemic demand.
The market's correction is longer than most and still hasn't found a floor
Total revenue peaked at $2.24B in 2021 and has fallen every year since -- $1.32B by 2025, a 41% decline. First-half 2026 revenue ($633.5M) is running at a similar monthly pace to 2025, showing no clear sign of bottoming out yet. At four consecutive years and counting, Colorado's downturn has already outlasted the typical post-peak correction seen in most other mature cannabis markets.
Medical's displacement was immediate and nearly complete, not gradual
Because Colorado's medical program predated adult use and both channels served overlapping demand from day one, medical's revenue share fell every year from 55.6% in 2014 to just 8.6% year-to-date in 2026 -- one of the faster, more complete medical-to-adult-use displacements a market of this size has shown, with no evidence of the multi-year post-launch growth period medical channels sometimes see elsewhere.
Patient enrollment has fallen further than revenue, with one important early caveat
Active registered patients have fallen 60% from the program's chaotic 2011 peak (127,816) to approximately 51,400 by June 2026, with only a brief pandemic-era uptick interrupting an otherwise steady decline since 2016. The 2009-2012 swings reflect early registry instability rather than a genuine demand signal and should be read separately from the more directly comparable 2014-onward figures.
Retail consolidation is proceeding through the open market, not a licensing ceiling
With no statewide ownership cap, Colorado's store count has contracted modestly (-10% since its 2022 peak) while per-store revenue has compressed more sharply (-35% since May 2020). The Native Roots/Verdant Capital Partners acquisition (Section 7) is an early signal that further consolidation is likely to happen through open-market M&A rather than through a regulatory limit on how many locations a single operator can hold.
Product mix has completed a genuine structural shift, and near-term risks cloud the outlook
Flower's revenue share fell from 50.1% in 2018 to under 39% by mid-2026, overtaken by concentrate -- a multi-year structural shift rather than a recent anomaly. At the same time, the regulatory developments in Section 7 -- wholesale price misreporting under active investigation and an intoxicating-hemp enforcement crackdown -- introduce real uncertainty about both the accuracy of currently reported figures and the pace of any near-term stabilization.
Developments to Watch
The following represent structural forces whose resolution will materially shape Colorado's cannabis market over the next one to three years. These are not predictions.
Consolidation Accelerates as Legacy Operators Sell
In March 2026, Verdant Capital Partners — a newly formed cannabis-focused equity firm — agreed to acquire 17 of Native Roots' 21 Colorado dispensaries. Native Roots, established in 2009, is one of the state's oldest and largest chains; the deal followed years of litigation between co-founders and left the company retaining just four stores plus its cultivation and manufacturing operations. Verdant's leadership has stated publicly that it expects Colorado's cannabis retail market to "continue to consolidate over time," and has signaled plans for three to four more acquisitions in other markets within twelve months.
The timing is notable: the deal is one of several cannabis M&A transactions that followed a December 2025 executive order directing federal agencies to work toward rescheduling cannabis to Schedule III. Combined with the retail-revenue compression documented in Section 4, consolidation of this kind is a plausible path for absorbing excess store capacity in a shrinking-revenue market with no statewide ownership cap to slow it.
- Additional MED license-transfer filings involving legacy Colorado operators
- Verdant Capital Partners' subsequent acquisition activity in and outside Colorado
- Whether store-count contraction (Section 4) accelerates as consolidation proceeds
Wholesale Price Misreporting and Tax Compliance Under Scrutiny
A June 2026 recording of a private meeting between Colorado's Marijuana Enforcement Division (MED) and industry representatives, made public by Mammoth Farms CEO Justin Trouard, revealed regulator concern over widespread wholesale transaction misreporting in METRC, the state's seed-to-sale tracking system. MED confirmed that thousands of suspicious entries — in some cases bulk marijuana reported at $1 a pound against a typical market value near $600 a pound — appear in the system monthly. MED director Dominique Mendiola acknowledged METRC is "a reporting tool and not a compliance tool," and state Sen. Marc Snyder characterized the situation as having "lost control of the regulatory system." Trouard has filed a class-action lawsuit alleging regulators knew of the practice and failed to act.
If substantiated at scale, this practice would mean the tax-revenue and possibly the sales-volume figures underlying this report understate the market's true wholesale activity, since underreported wholesale value can flow through to downstream tax calculations. No official estimate of the revenue impact has been published.
- Outcome of Trouard's class-action suit against Colorado regulators
- Any MED emergency rulemaking addressing METRC reporting integrity
- Colorado Department of Revenue disclosures on estimated uncollected marijuana tax revenue
Intoxicating Hemp Enforcement and the Federal Ban
In April 2026, MED announced plans to crack down on marijuana businesses illegally substituting chemically converted hemp-derived THC for regulated marijuana — a practice regulators say creates both tax-avoidance and public-safety risk, since converting hemp-derived CBD into THC can leave toxic chemical residues (methylene chloride was found in one 2024 case that led a manufacturer to surrender its license). A prior Denver Gazette/ProPublica investigation found Colorado, despite being the first state to legalize recreational marijuana, had not adopted many of the safeguards other states use to keep hemp products off dispensary shelves.
Separately, a federal law passed in late 2025 bans most intoxicating hemp products nationally, officially effective in fall 2026, though implementation details remain unresolved and hemp manufacturers are lobbying to overturn it; a December 2025 executive order directed the administration to explore allowing some hemp products to continue. Denver's licensing director has cited hemp-derived competition in other states as a contributing factor in Colorado's sales decline (Section 1).
- MED emergency rules on hemp-derived product testing and enforcement
- Federal implementation (or reversal) of the fall 2026 intoxicating-hemp ban
- Additional license suspensions/revocations tied to hemp substitution
Competitive and Demand-Side Headwinds
City and industry officials attribute Colorado's post-2020 sales decline to several compounding factors beyond in-state dynamics: an expanding number of other states and Colorado municipalities now offering legal retail cannabis (reducing Colorado's role as a regional draw), reduced consumer discretionary spending, and hemp-derived product competition from states with looser rules. Denver's cannabis social-equity licensing program — which currently reserves most new Denver marijuana business licenses for social-equity applicants at reduced fees — is scheduled to sunset in 2027, a structural change to the local licensing landscape independent of statewide trends.
- Denver's social-equity program review and any extension or replacement policy ahead of the 2027 sunset
- New state legal-cannabis markets opening near Colorado's borders
- Consumer spending indicators as a proxy for discretionary cannabis purchases
Data Sources and Methodology
- Sales data (Medical & Adult Use, 2014–2026): merged from two sources. January 2014 only is sourced from CO_Cannabis_Revenue.xlsx (the state's public Tableau dashboard export used for 2015 onward does not include 2014). February 2015 through June 2026 is sourced from Monthly_Sales_2_New_Full_Data_data.csv, an official export from the Colorado public Tableau dashboard (public.tableau.com, CU Business Research Division). The two sources matched exactly for January 2015–December 2020; from January 2021 onward the dashboard export runs slightly higher than the original extract (+0.45% cumulative on adult-use, +0.67% on medical through 2025, consistent with routine upward revision as late-filed returns are incorporated), with the largest single-month gap in December 2023 (+9.6% adult-use, +5.9% medical). The dashboard export was treated as authoritative for all overlapping months.
- Patient data (active monthly): CO_Table_of_Patient_Cou_*.xlsx (two near-duplicate exports; the longer series, January 2009–June 2026, was used). Single metric: active registered medical patients per month. No cumulative lifetime-approval series was provided.
- Retail store count: CO_Store_Count.xlsx, "Total # Active Facilities by Month." May 2020–June 2026. Despite the source file's generic label, this figure reflects licensed retail dispensary locations (combined medical and adult-use); it does not include Colorado's separately licensed cultivation, manufacturing, or testing facilities.
- Ownership/licensing structure: HB18-1011 (Colorado General Assembly, 2018 investor-cap repeal); Marijuana Enforcement Division licensing rules (med.colorado.gov); local jurisdiction licensing pages (e.g., City of Colorado Springs).
- 2026 revenue, patient, and store data all partial through June 2026. All figures in USD. Revenue figures rounded to nearest $100K.
- Cannabis tourism trend: Colorado Department of Revenue 2014 resort-town sales analysis (via CBS News Colorado, October 2014); Colorado Legislative Council Staff September Economic & Revenue Forecast, as reported by Marijuana Moment (2024); Arizona (Nov. 2020 vote, retail launch early 2021) and New Mexico (2021 law, retail launch April 2022) recreational legalization dates.
- Peer-state comparison (Washington): Washington Dept. of Revenue sales figures as reported by MJBizDaily ("Washington cannabis sales fell to $1.14 billion in 2025"), KUOW, and Tri-Cities Area Journal of Business, retrieved August 2026. Washington's medical/adult-use channel split is not tracked with the same granularity as Colorado's, so the comparison is presented at the total-market level.
- Section 7 developments: Cannabis Equipment News and Westword (Native Roots/Verdant Capital Partners acquisition, March 2026); CBS News Colorado, "After Colorado warns of illegal activity in marijuana industry, private meeting reveals extent of problem" (June 12, 2026); ProPublica/The Denver Gazette, "Colorado Marijuana Regulators Pledge Crackdown on Intoxicating Hemp" (April 14, 2026); Denver7, "Real Talk: Colorado's cannabis industry continues to face challenges" (July 31, 2026).
- Product category shares (Section 5): Product_Sales_Share__2__Full_Data_data.csv, Colorado public dashboard export. Two windows: (a) six data points originally dated 7/10/1905-7/15/1905, decoded as annual category shares for 2018-2023 (a corrupted year field mis-cast as an Excel/Tableau date serial on export -- confirmed by cross-checking against CO_Product.xlsx annual dollar totals, which matched within rounding), and (b) monthly share-of-sales percentages, October 2025-June 2026. Dollar figures throughout Section 5 are derived by applying category shares to channel-level (medical/adult-use) revenue from the merged revenue dataset (Section 1), not sourced directly as dollars. Category shares total ~98-99% of revenue per period; the residual is not broken out by category in the source and is excluded. No data covers 2024 through September 2025.