
Seven years of Ohio DCC data tracking revenue growth, patient registration trends, and the structural changes that followed adult use legalization in 2024.
Ohio DCC Data | Sales · Patient Registration · Dispensary Activity | May 2026
Executive metrics
|
Total Cumulative Revenue $3.77B Jan 2019–Apr 2026 |
Adult Use Cumulative $1.42B Since Aug 6, 2024 |
Medical Cumulative $2.35B Since Jan 14, 2019 |
|
Registered Patients 461,767 As of Apr 2026 |
Active Dispensaries 204 As of Mar 2026 |
Peak Monthly Revenue $112.6M January 2026 |
Note: Interactive charts available in companion Excel workbook (Ohio_DCC_Combined_Analysis.xlsx).
SECTION 1
Market size and annual revenue trajectory
Ohio's cannabis market grew from a standing start of $5.2M in cumulative sales through April 2019 to nearly $3.8B by April 2026 — a seven-year compound story of medical market expansion followed by a step-change when adult use launched in August 2024. The transition fundamentally restructured the market: adult use overtook medical as the primary revenue source within roughly six months of launch.
Figure 1: Annual revenue by channel, 2019–2026

Source: Ohio DCC Historical Sales Data. 2026 partial through approx. April 25.
Table 1: Annual sales by channel
|
Year |
Medical Sales |
Adult Use Sales |
Total Sales |
Med YoY |
AU YoY |
Total YoY |
Note |
|
2019 |
$56M |
— |
$56M |
— |
— |
— |
Medical only |
|
2020 |
$221M |
— |
$221M |
+295% |
— |
+295% |
Medical only |
|
2021 |
$380M |
— |
$380M |
+72% |
— |
+72% |
Medical only |
|
2022 |
$469M |
— |
$469M |
+23% |
— |
+23% |
Medical only |
|
2023 |
$485M |
— |
$485M |
+3% |
— |
+3% |
Medical only |
|
2024 |
$452M |
$242M |
$694M |
-7% |
— |
+43% |
AU launched Aug 6 |
|
2025 |
$222M |
$758M |
$980M |
-51% |
+213% |
+41% |
First full AU year |
|
2026* |
$65M |
$390M |
$455M |
— |
— |
— |
Partial to Apr 25 |
* 2026 data partial through approximately April 25, 2026.
SECTION 2
The medical-to-adult use transition
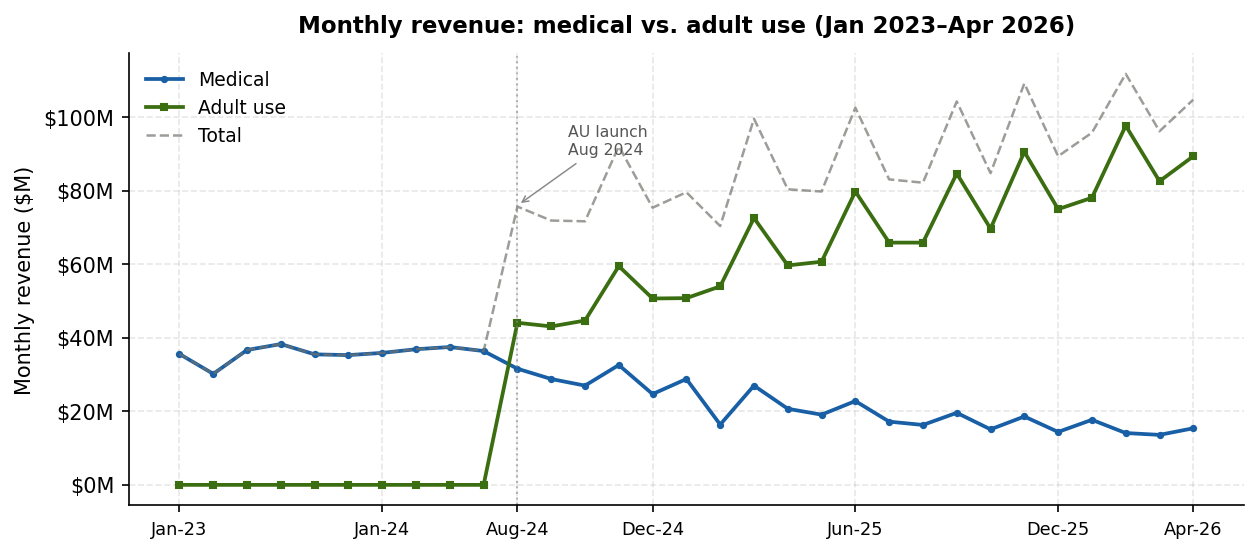
The most significant inflection in the dataset is the August 2024 adult use launch. Medical monthly revenue, which had averaged $41.1M/month in the first seven months of 2024, dropped to $21.5M/month in the subsequent 21 months — a 48% decline. Meanwhile adult use quickly established a $44M/month run rate at launch and has since grown to approximately $80–95M/month. Total market revenue more than doubled from the pre-launch pace.
Key finding: Adult use did not simply add new demand — it cannibalized a significant portion of medical spending. The remaining medical base appears anchored by patients who genuinely need the medical program: higher purchase limits, potential tax advantages, or physician guidance.
Figure 2: Monthly revenue by channel, January 2023–April 2026

Source: Ohio DCC Historical Sales Data. Monthly figures derived from cumulative snapshot differentials.
Table 2: Monthly average revenue by market phase
|
Period |
Med Monthly Avg |
AU Monthly Avg |
Total Monthly Avg |
Med Share |
Market Phase |
|
2022 (full year) |
$39.1M |
— |
$39.1M |
100% |
Medical only |
|
2023 (full year) |
$40.4M |
— |
$40.4M |
100% |
Medical only |
|
Jan–Jul 2024 |
$41.1M |
— |
$41.1M |
100% |
Medical only |
|
Aug–Dec 2024 |
$28.6M |
$48.5M |
$77.1M |
37% |
Transition |
|
2025 (full year) |
$18.5M |
$63.2M |
$81.7M |
23% |
AU dominant |
|
Q1 2026 |
$15.1M |
$92.5M |
$107.6M |
14% |
AU dominant |
The August 2024 dual-use conversion is important context: the 121 licenses issued that month were conversions for existing medical dispensaries, not new entrants. The store count barely moved (126 to 127). The same locations instantly served a far larger customer base with no new capital required.
Product mix data from the DCC's product sales report reveals that medical and adult use customers purchase nearly identical product assortments — both channels show approximately 50% plant material, 31–34% vapes, and 13–15% edibles. This convergence has direct implications for the reverse migration thesis discussed in Section 7: if medical patients were staying for specialized therapeutic formats unavailable in the adult use channel, product mix data would show divergence. It does not. The appeal of maintaining a medical card rests on structural economics — tax differential, purchase limits, potency access — rather than product specialization.
SECTION 3
Patient registration: growth deceleration
Ohio added patients at a healthy pace through 2022, then the rate slowed considerably. In 2022, Ohio added roughly 85,700 net new patients. In 2025, it added only 14,600. This is a structural shift: Ohioans who want cannabis but do not need the medical program's specific benefits no longer have reason to register.
Data quality note: The patient count report contains apparent anomalies. April and May 2023 show counts lower than March 2023, and July 2023 shows a count lower than June 2023. These appear to reflect reporting methodology changes rather than actual attrition and are retained as reported.
Figure 3: Registered medical cannabis patients

Source: Ohio DCC Table of Patient Count by Month. Select snapshot dates only.
Table 3: Patient registration trends by year
|
Year |
Start Count |
End Count |
Net New Patients |
YoY Growth |
Note |
|
2021 |
168,571 |
237,613 |
+69,042 |
+41% |
Rapid expansion |
|
2022 |
244,611 |
330,280 |
+85,669 |
+35% |
Peak annual additions |
|
2023 |
338,049 |
390,751 |
+52,702 |
+16% |
Growth slowing |
|
2024 |
399,570 |
428,167 |
+28,597 |
+7% |
AU launched Aug 2024 |
|
2025 |
429,855 |
444,494 |
+14,639 |
+3% |
Near plateau |
|
2026† |
456,297 |
461,767 |
+5,470 |
~2% ann. |
Partial; to Apr 2026 |
† 2026 data partial through April 2026. Annualized growth rate is approximate.
SECTION 4
Dispensary expansion and licensing
During the medical-only era (2019–2023), Ohio's licensed dispensaries grew slowly to 60 by end-2022. Then in 2023, adult-use anticipation drove a licensing acceleration — dispensary count nearly doubled from 60 to 118 in a single year. The August 2024 adult use launch triggered 121 dual-use conversions of existing medical dispensaries, not new store openings.
Figures 4 and 5: Dispensary count and revenue per location
|
Fig 4: Active dispensaries at year-end |
Fig 5: Monthly revenue per dispensary |


Table 4: Dispensary count and revenue context
|
Period |
Active Dispensaries |
New Licenses Issued |
Med Monthly Avg Rev |
Note |
|
Dec 2020 |
51 |
2 |
$18.4M |
Medical only era |
|
Dec 2021 |
57 |
9 |
$31.7M |
Medical only era |
|
Dec 2022 |
60 |
1 |
$39.1M |
Stable dispensary count |
|
Dec 2023 |
118 |
38 |
$40.4M |
Adult use anticipation; licensing surge |
|
Aug 2024 |
127 |
121 |
$31.6M |
121 dual-use conversions of existing stores |
|
Dec 2024 |
126 |
2 |
$24.7M |
Same stores, vastly larger customer base |
|
Dec 2025 |
189 |
27 |
$14.4M |
New locations opening; medical declining |
|
Mar 2026 |
204 |
0 |
— |
Continued expansion |
SECTION 5
Unit economics and price trends
Two unit economics metrics tell the story of market maturation: revenue per dispensary per month, and price per unit across product categories. Both reflect the same underlying dynamic — a market growing in volume but compressing in per-unit pricing.
Figure 6: Estimated monthly medical revenue per registered patient

Source: Ohio DCC sales and patient data. Approximate — uses point-in-time patient snapshots.
Figure 7: Revenue by product category — medical vs. adult use

Source: Ohio DCC Amount of Product Sold report. Medical 2021–2025; Adult Use 2024–2025.
The product mix data reveals two analytically important supply-side dynamics. First, edibles dominated the early medical market — representing 55% of medical revenue in 2021 — before collapsing to 15% by 2022 and stabilizing there through today. This was not a patient preference shift; it reflected supply-side maturation. As Ohio's cultivation sector scaled, abundant plant material displaced manufactured products as the dominant category. Second, plant material and vapes have remained remarkably stable in share since 2022: plant at roughly 50–53% and vapes at 31–34% of medical revenue each year, a consistency that held even through the adult use launch. The adult use channel launched with an almost identical mix, confirming that format preferences are not what differentiates the two programs.
The significance for price compression: plant material now accounts for roughly half of total revenue in both channels, and it is also the category experiencing the sharpest price decline — approximately 40% from the 2021 peak. A 40% price decline in the market's largest category compounds unit economics pressure in ways the total revenue trend alone does not reveal.
Table 5: Annual unit economics
|
Year |
Med Monthly Avg |
AU Monthly Avg |
Total Monthly Avg |
Patient Growth |
YE Dispensaries |
Rev/Dispensary/Mo |
|
2020 |
$18.4M |
— |
$18.4M |
N/A |
51 |
$361K |
|
2021 |
$31.7M |
— |
$31.7M |
+41% |
57 |
$556K |
|
2022 |
$39.1M |
— |
$39.1M |
+35% |
60 |
$652K |
|
2023 |
$40.4M |
— |
$40.4M |
+16% |
118 |
$342K |
|
2024 |
$37.6M |
$28.4M |
$66.0M |
+7% |
126 |
$524K |
|
2025 |
$18.5M |
$63.2M |
$81.7M |
+3% |
189 |
$432K |
Table 6: Average prices by product category and period
|
Period |
Program |
Plant |
Vapes |
Edibles |
Note |
|
2022 |
Medical |
~$26.00 |
$50.93 |
$34.30 |
Earliest consistent unit data |
|
2023 |
Medical |
~$18.00 |
$33.82 |
$25.56 |
-33% vape, -25% edible vs 2022 |
|
2024 |
Medical |
~$17.00 |
$30.69 |
$23.47 |
Pre-AU launch pricing |
|
2024 |
Adult Use |
~$21.00 |
$34.05 |
$22.99 |
Partial year (Aug–Dec); plant launch premium |
|
2025 |
Medical |
~$18.00 |
$30.89 |
$21.11 |
Post-AU; pricing broadly stable |
|
2025 |
Adult Use |
~$18.50 |
$32.40 |
$21.14 |
Slight AU vape premium persists |
|
2026 YTD |
Medical |
~$18.00 |
$30.24 |
$20.64 |
Jan–Feb only |
|
2026 YTD |
Adult Use |
~$18.00 |
$31.75 |
$20.83 |
Jan–Feb only |
* Plant prices: Ohio DCC Historical Sales Data (reported averages per 1/10 oz).
** Vape and edible prices per unit: derived from Ohio DCC Amount of Product Sold report (category dollars ÷ category units). These replace the prior blended "Manufactured per unit" average. 2021 excluded due to inconsistent unit definitions in early reporting data.
Price compression of approximately 40% from the 2021 peak mirrors the trajectory seen in mature state markets. Edible prices have compressed roughly 40% since 2022; vape prices compressed 40% between 2022 and 2023 and have since plateaued near $30–34/unit.
SECTION 6
Conclusions: what the data tells us
1 — Ohio has a durable, large-scale cannabis market
$3.77B in cumulative sales across seven-plus years, with monthly run rates now exceeding $100M, places Ohio among the larger state cannabis markets in the US. The market is maturing but not stagnant — adult use provides a multi-year growth runway and the licensed channel is broadly healthy.
2 — Adult use cannibalized medical but grew the total market 2–2.5x
Medical monthly revenue fell roughly 48% after the adult use launch. Total market revenue grew from approximately $41M/month to $90–110M/month. The structural composition has flipped, with adult use now representing roughly 80% of monthly revenue.
3 — Patient registration has effectively peaked, for now
With adult use available, new patient registrations are running at approximately 2–3% annually. Existing cardholders face a renewal decision each year; many will not renew if the medical program offers no compelling advantage over simply buying adult use.
4 — Dispensary economics are tightening, not collapsing
The dual-use conversion of existing medical dispensaries in August 2024 was an operational windfall — the same locations immediately served a far larger addressable market with no new capital required. Active facility count has since grown from 127 to 204, and further growth is in the pipeline.
5 — Price compression remains a structural headwind
Plant material prices fell roughly 40% from the 2021 peak. Category-level data shows vape prices compressed 40% between 2022 and 2023 before stabilizing near $30–34/unit; edible prices continue declining. Since plant material now represents approximately half of revenue in both channels, its price trajectory has an outsized effect on total market economics.
6 — The illicit market is the overlooked third option for displaced buyers
Any analysis of where displaced hemp buyers go must account for three destinations: dispensaries, the illicit market, and market exit. New Frontier Data estimated the national illicit cannabis market at approximately $70.9 billion in 2024 against a $35 billion legal market — meaning unlicensed cannabis is still roughly twice the size of the licensed channel nationally.
The assumption that hemp suppression straightforwardly benefits the licensed channel is too optimistic and lacks evidentiary support. The destination split — dispensaries, illicit market, market exit — cannot be reliably sized with available data, and should not be.
SECTION 7
Developments to watch
The following developments are not predictions. Each represents a structural force whose resolution will materially shape Ohio's cannabis market over the next two to four years.
Ohio hemp market shutdown [Near-term]
Ohio's intoxicating hemp market — delta-8 THC, HHC, and related products sold through gas stations and smoke shops — represented a substantial consumer channel before state regulatory action. Its closure displaces buyers without redirecting them to any single destination. The licensed dispensary channel, the illicit market, and simple market exit are all plausible outcomes for different buyer segments, and no reliable data currently allows those segments to be sized.
The typical convenience store shopping occasion (average in-store basket: $7.80 per visit, NACS 2023) and the typical dispensary visit (average transaction: $58–82 by product format, New Frontier Data) represent meaningfully different behavioral commitments. Peer-reviewed research (Rossheim et al., Cannabis and Cannabinoid Research, 2024) confirms that intoxicating hemp retail was disproportionately concentrated in socioeconomically deprived areas — the same communities where illicit market infrastructure is typically strongest.
The licensed channel's closest format analog to hemp convenience products — pre-rolls and single-serving units (classified as 'Other' in DCC product data) — is among the fastest-growing adult use categories, expanding from negligible revenue in mid-2025 to approximately $5.9M monthly by January 2026. This growth may represent partial capture of former hemp buyers migrating to the licensed channel, though without customer-level data the directionality cannot be confirmed.
Signals to monitor:
- Adult use monthly revenue trajectory over the next 12–18 months — acceleration above current run rate could indicate dispensary migration
- Any Ohio DCC or law enforcement data on illicit market activity post-hemp shutdown
- Patient registration trends — any reversal of deceleration would be notable
- Geographic distribution of new adult use customers relative to former hemp retail locations
Federal rescheduling to Schedule III [Medium-term]
The DEA's proposed reclassification of cannabis from Schedule I to Schedule III remains in process. If finalized, the most immediate financial consequence for Ohio dispensaries would be relief from IRS Section 280E, which currently prohibits plant-touching cannabis businesses from deducting ordinary business expenses. Effective tax rates for some operators run 60–80% as a result; Schedule III removes that classification and could dramatically improve dispensary profitability without any change in revenue.
Beyond taxes, rescheduling normalizes the federal posture in ways that improve banking access and attract mainstream capital. For the medical program specifically, Schedule III opens pathways for VA physician engagement with veterans — a large and currently excluded patient population — and creates the regulatory predicate for eventual insurance coverage discussions.
Signals to monitor:
- Final DEA rulemaking timeline and any legal challenges
- IRS guidance on 280E applicability post-rescheduling
- Whether Ohio medical patient registrations stabilize or recover following federal legitimization
- Banking and capital market access improvements for Ohio operators
Potential reverse migration: adult use buyers returning to medical [Speculative]
Medical cannabis in Ohio carries lower tax rates than adult use, which is subject to a 10% excise tax on top of standard sales tax. Medical patients also benefit from higher purchase limits and, in some product categories, access to higher-potency formulations. For a regular, high-volume consumer spending several hundred dollars per month at a dispensary, the annual cost of maintaining a medical card (approximately $100–200) could be more than offset by tax savings alone.
Product mix data adds an important qualification to this thesis: medical and adult use customers currently purchase nearly identical product assortments, which suggests the re-engagement incentive is economic rather than product-driven. Patients would be returning for the tax and purchase-limit advantages, not because the medical channel offers meaningfully different products. That is a narrower but still real value proposition — and one that becomes more compelling as total monthly spend increases.
Signals to monitor:
- Ohio medical patient renewal rates — whether attrition stabilizes among active, high-volume cardholders
- Legislative changes to Ohio's medical cannabis tax treatment relative to adult use
- Whether rescheduling triggers a measurable uptick in new medical patient registrations, particularly among veterans
- Dispensary-level data, if published, showing movement between medical and adult use channels among the same customers
Data sources and methodology
- Sales data: Ohio DCC Historical Sales Data (Rev. 5/1/2026). Cumulative totals at irregular weekly intervals; monthly figures derived from cumulative snapshot differentials.
- Patient data: Ohio DCC "Table of Patient Count by Month." Select snapshot dates only; anomalous readings in Apr–May 2023 and Jul 2023 retained as reported.
- Facility data: Ohio DCC "Total Facilities in Ohio" CSV export. Monthly active dispensary count and new licenses issued.
- Product mix data: Ohio DCC "Amount of Product Sold" report. Monthly revenue and units by product category, Jan 2021–Feb 2026. Used to derive category-specific price per unit in Table 6 and product mix analysis in Section 5.
- Convenience store basket: NACS State of the Industry 2023, via CSP Daily News (April 2024). Average in-store basket of $7.80 per visit.
- Dispensary transaction values: New Frontier Data via cannabismeansbusiness.com. Flower $82.31, vape $73.66, edibles $58.36 per transaction.
- Illicit market estimate: New Frontier Data 2024, via cannabismeansbusiness.com. National estimate; Ohio-specific data not separately published.
- Hemp retail characteristics: Rossheim ME et al. Cannabis and Cannabinoid Research, 2024;9(1):363–370. doi: 10.1089/can.2022.0079. PMID: 36342930.
- April 2026 data partial through approximately April 25, 2026. All figures in USD.