

Market Size and Annual Revenue Trajectory
Illinois launched its medical cannabis program in November 2015, accumulating modest sales through a restrictive regulatory framework that limited patient enrollment and dispensary licenses. The market remained a niche medical channel through 2019, reaching a cumulative medical base of approximately $260M for the year. Adult use legalization on January 1, 2020 transformed the market overnight: Illinois entered 2020 with 55 operational dispensaries that were immediately authorized to serve recreational customers, producing $669M in adult use revenue in the program's first calendar year alone.
From 2020 through 2024, Illinois grew into one of the five largest state cannabis markets in the US, crossing $2B in annual total sales in 2024. The 2025 reversal — total revenue declining roughly 15% year-over-year — marks Illinois's entry into a mature-market correction phase that reflects both price compression and a saturating consumer base.
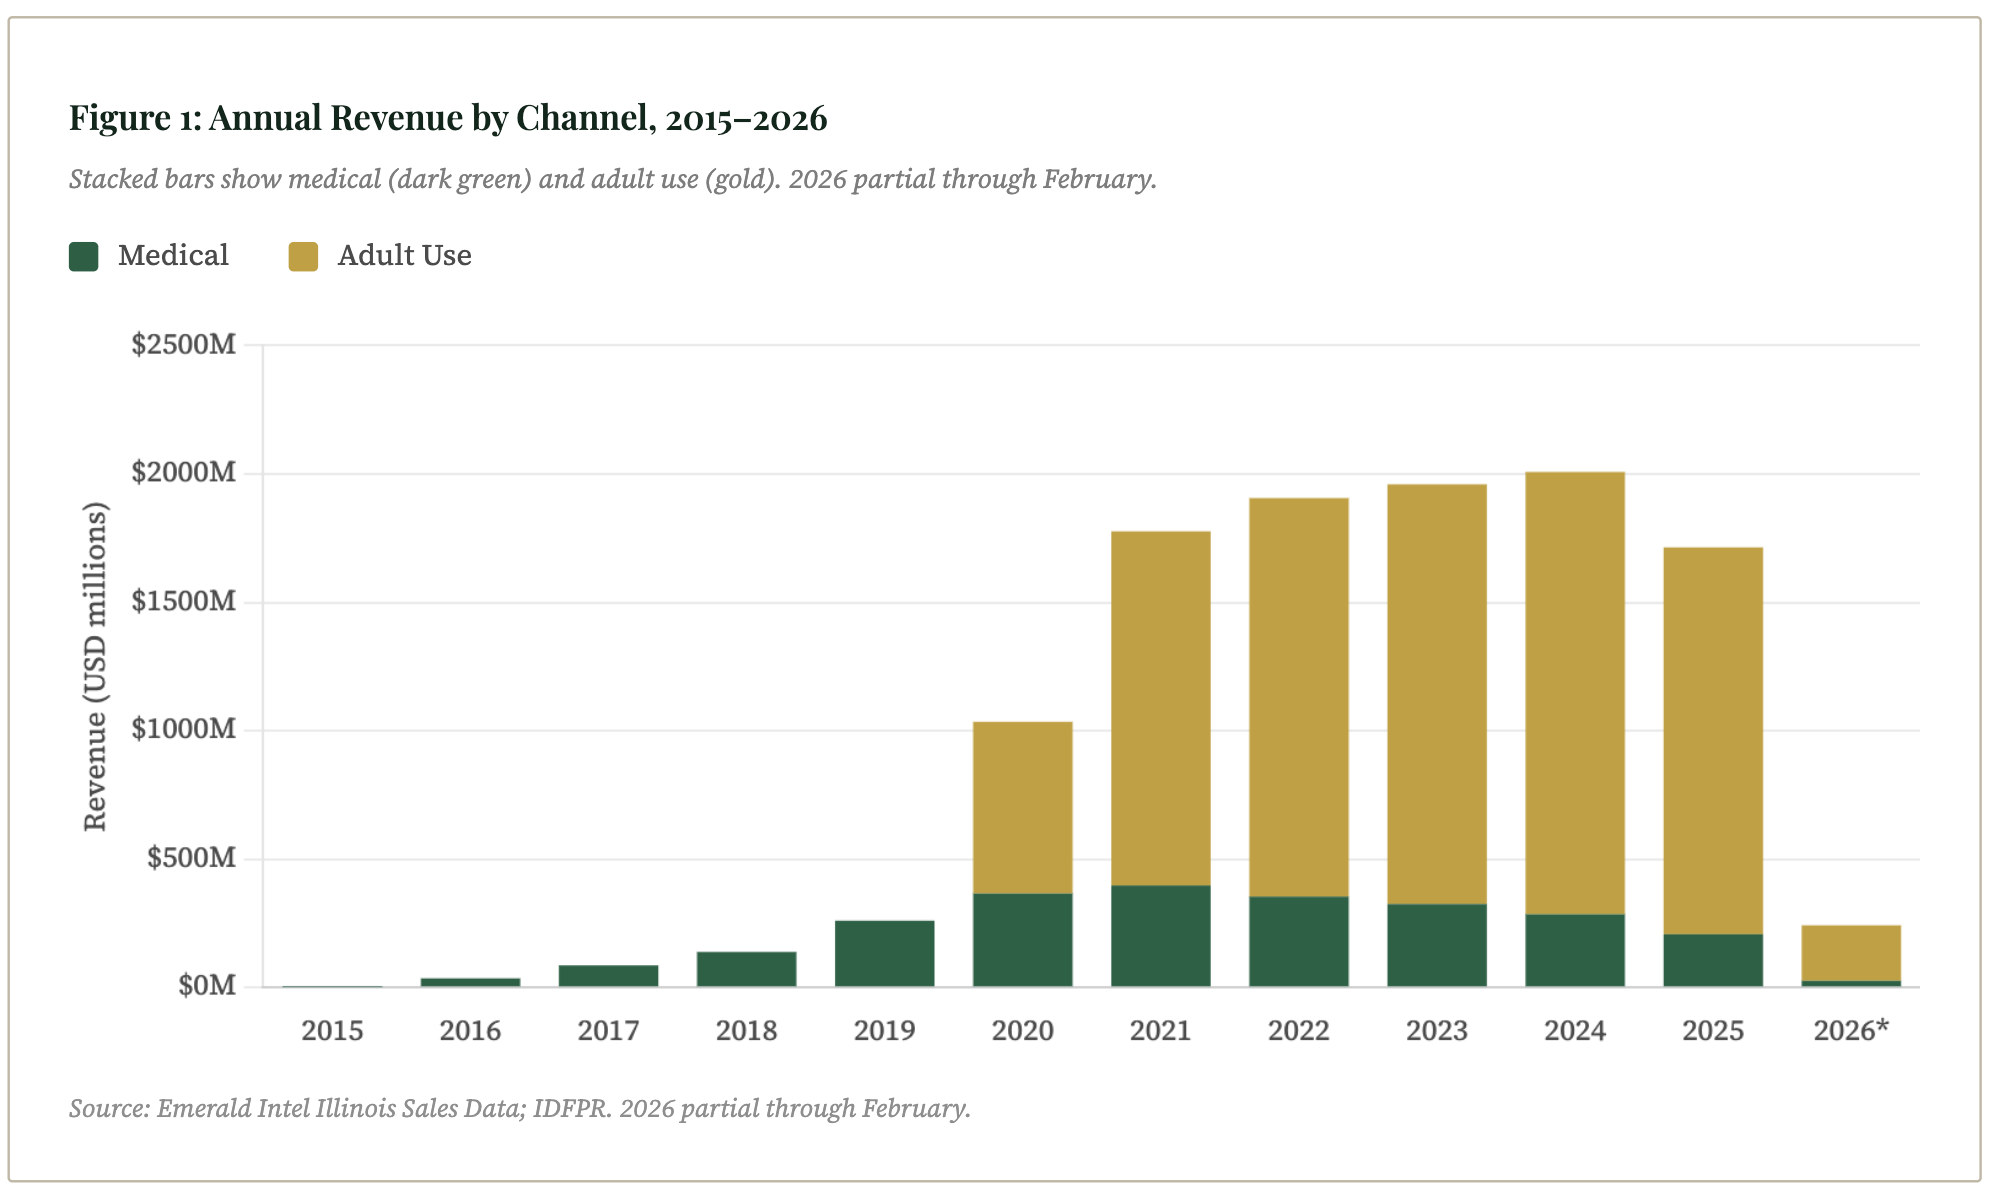
Source: Emerald Intel Illinois Sales Data; IDFPR. 2026 partial through February.
| Year | Medical Sales | Adult Use Sales | Total Sales | Med YoY | AU YoY | Total YoY | Note |
|---|---|---|---|---|---|---|---|
| 2015 | $1.7M | — | $1.7M | — | — | — | Medical only; partial year |
| 2016 | $35.6M | — | $35.6M | +2,000%+ | — | — | Medical only; program scaling |
| 2017 | $86.3M | — | $86.3M | +143% | — | — | Medical only |
| 2018 | $138.4M | — | $138.4M | +60% | — | — | Medical only |
| 2019 | $260.2M | — | $260.2M | +88% | — | — | Medical only; pre-legalization surge |
| 2020 | $365.8M | $669.1M | $1.03B | +41% | — | — | Adult use launched Jan 1 |
| 2021 | $397.3M | $1.38B | $1.78B | +9% | +106% | +72% | AU doubles; medical peaks |
| 2022 | $353.8M | $1.55B | $1.91B | -11% | +12% | +7% | Medical decline begins |
| 2023 | $324.8M | $1.63B | $1.96B | -8% | +5% | +3% | Market growth decelerating |
| 2024 | $285.0M | $1.72B | $2.01B | -12% | +5% | +3% | AU peak year |
| 2025 | $207.2M | $1.51B | $1.71B | -27% | -12% | -15% | Both channels contracting |
| 2026* | $26.0M | $216.0M | $242.0M | — | — | — | Partial through Feb 2026 |
* 2026 data partial through February 2026. All figures in USD. Emerald Intel data.
Medical and Adult Use: A Diverging Trajectory
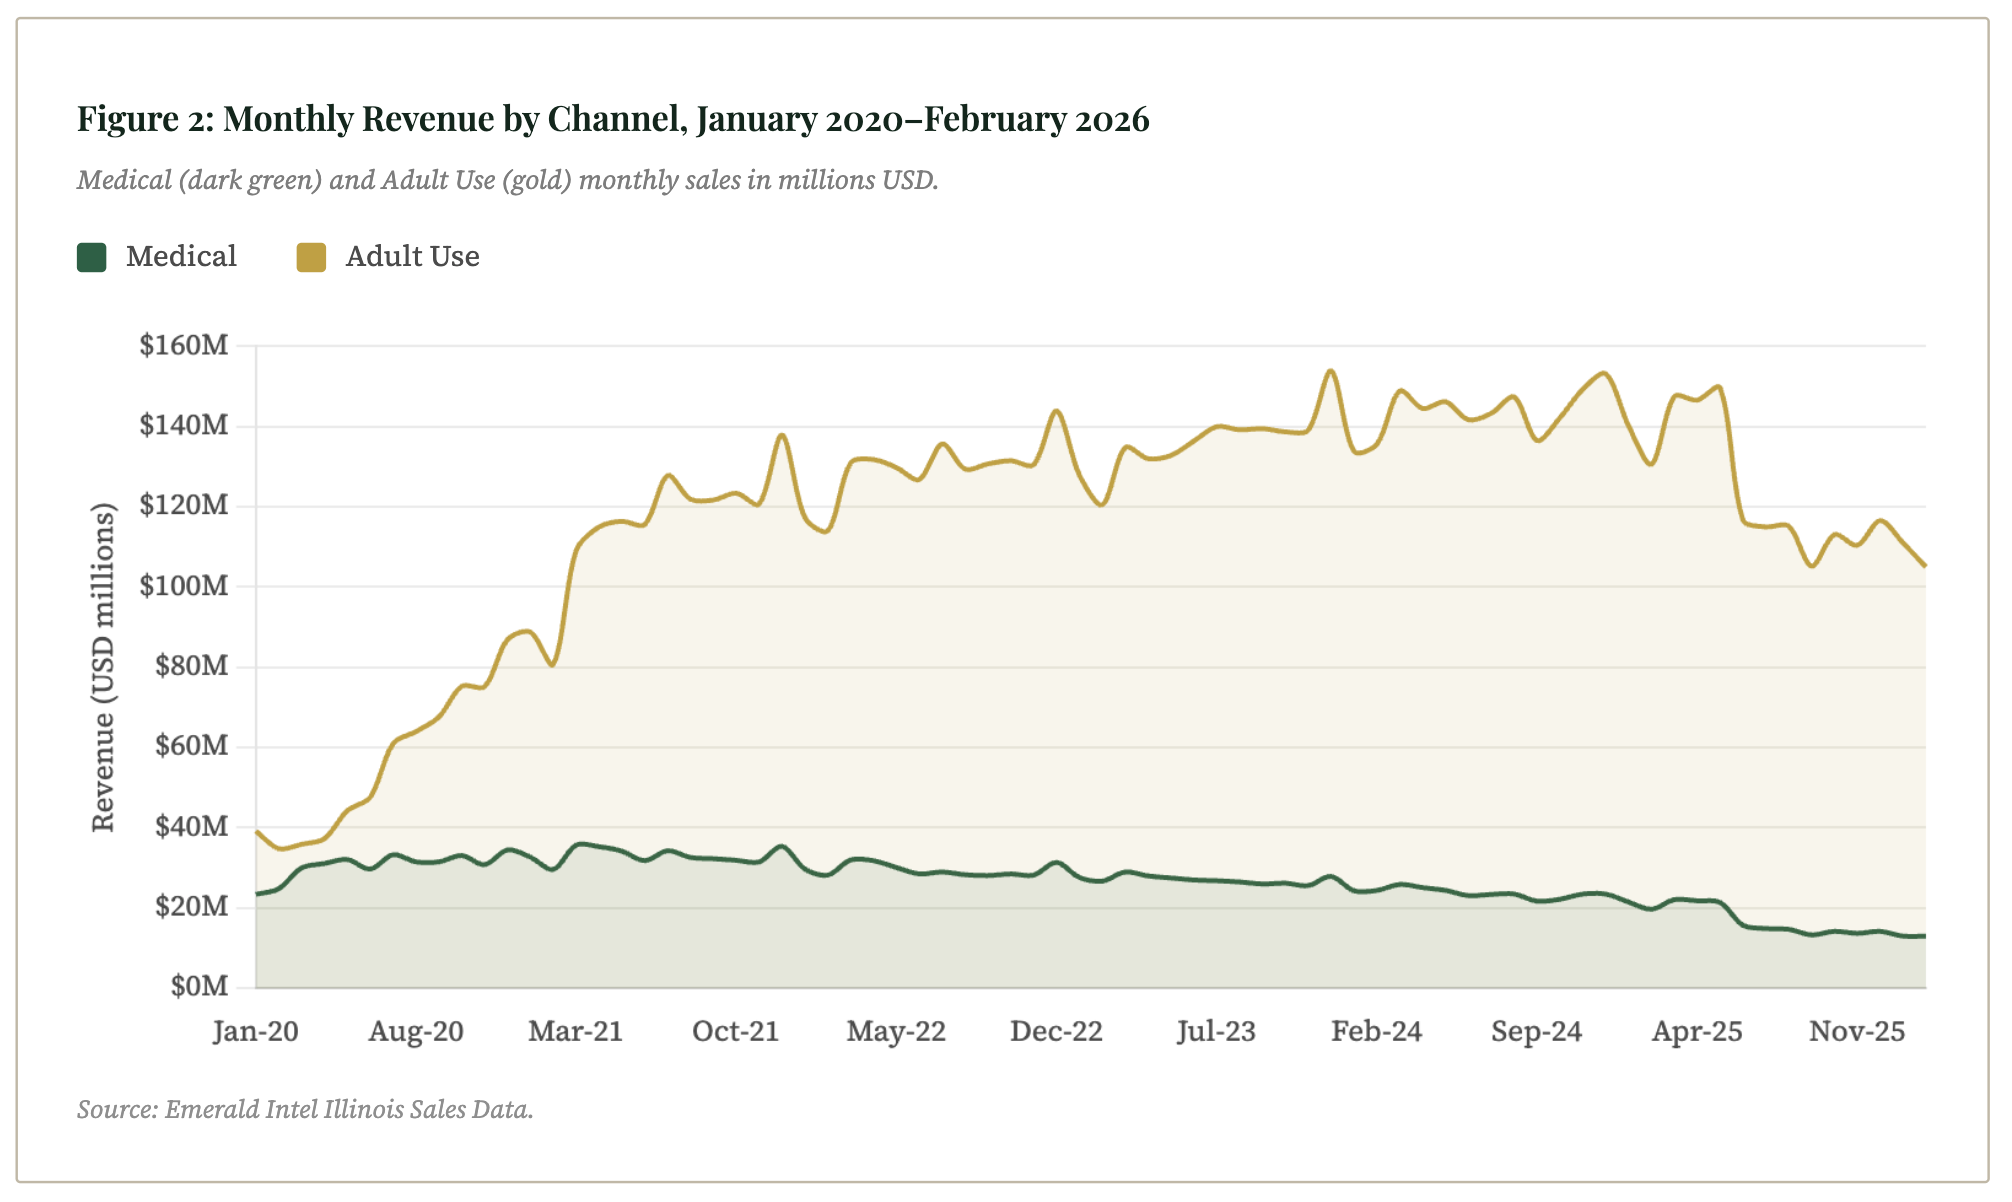
Illinois's medical program was one of the most restrictive at launch — narrow qualifying conditions, mandatory fingerprinting, and no home cultivation — which suppressed early patient growth. As those restrictions eased through 2018–2019, medical revenue surged, peaking at a monthly average of $33.1M in 2021. That peak coincided with adult use's first full year of rapid scaling, which meant the two channels briefly coexisted at high volume. The divergence accelerated from 2022 onward: medical fell every year while adult use continued growing through 2024.
Unlike Ohio, where adult use launched in 2024 into a long-established medical market that had already plateaued, Illinois's transition unfolded differently. When adult use launched on January 1, 2020, the medical program was still in active growth — 2019 medical revenue had risen 88% year-over-year to $260M, driven by expanding qualifying conditions and rising patient enrollment. Rather than arriving into a stagnant medical base, adult use entered alongside a medical channel that was itself still scaling. The two programs grew in parallel through 2021 before medical began its sustained contraction — a more gradual displacement than markets where adult use encountered an already-plateaued medical program. Medical monthly revenue has declined 48% from its 2021 average of $33.1M to $17.3M in 2025 — a structural shift that accelerated sharply in the second half of 2025, when monthly medical figures dropped below $16M for the first time since 2019.
| Period | Med Monthly Avg | AU Monthly Avg | Total Monthly Avg | Med Share | Phase |
|---|---|---|---|---|---|
| 2019 | $21.7M | — | $21.7M | 100% | Medical only |
| 2020 | $30.5M | $55.8M | $86.2M | 35% | AU launch year |
| 2021 | $33.1M | $114.9M | $148.0M | 22% | AU scaling rapidly |
| 2022 | $29.5M | $129.4M | $158.8M | 19% | Medical declining |
| 2023 | $27.1M | $136.2M | $163.3M | 17% | AU dominant |
| 2024 | $23.8M | $143.6M | $167.3M | 14% | AU peak |
| 2025 | $17.3M | $125.6M | $142.8M | 12% | Both contracting |
| 2026 YTD | $13.0M | $108.0M | $121.0M | 11% | Continued decline |
Patient Enrollment: Two Measures, One Story
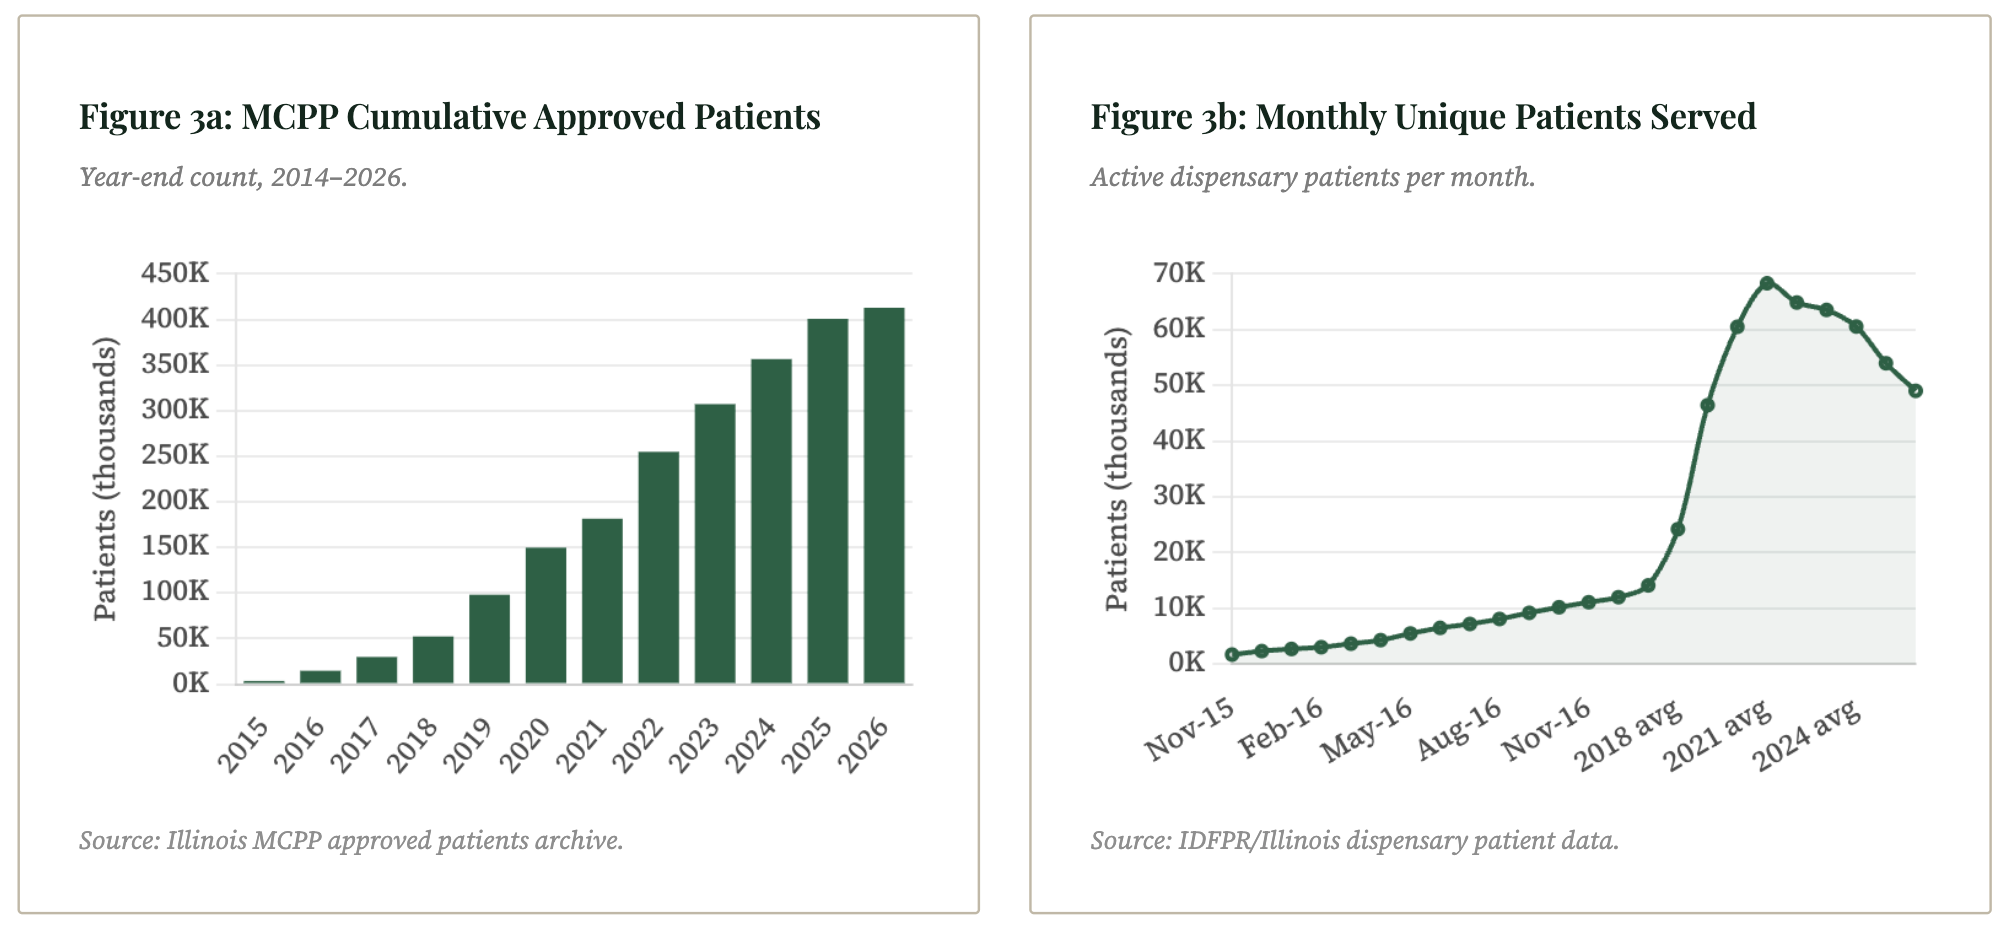
Illinois tracks medical cannabis patients through two distinct lenses: cumulative approved qualifying patients under the MCPP (a lifetime-registration count), and monthly unique patients served at dispensaries (an activity measure). Both tell the same story — a program that grew rapidly through 2021, plateaued, and is now in gradual but unmistakable decline.
MCPP cumulative approvals have grown every year without interruption, reaching 412,832 by March 2026. But this metric is a cumulative stock, not a flow — it counts everyone ever approved, including patients who have since lapsed, died, or simply stopped using the program. The rate of net new approvals tells a more instructive story: annual additions peaked at ~73,000 in 2022, then fell to ~52,000 in 2023, ~49,000 in 2024, and ~44,000 in 2025 — a decelerating growth curve that reflects a program losing its appeal to new entrants as adult use becomes the path of least resistance for most consumers.
Monthly unique patients served is the more operationally meaningful measure: it captures who is actively purchasing. This metric peaked at 70,600 in July 2021, then declined slowly at first (-5% in 2022, -2% in 2023), before accelerating sharply — falling 11% in 2025 alone. By early 2026, the active patient base had fallen to approximately 49,000 per month — a 30% decline from the 2021 peak, and the steepest single-year drop on record. The pace of decline is worsening, not stabilizing. Adult use availability is the primary driver: patients who registered for convenience or curiosity rather than genuine medical need have migrated to the adult use channel, and the rate of that migration is increasing.
| Year | MCPP Approved (YE) | Net New (MCPP) | Avg Monthly Active | Active YoY | Note |
|---|---|---|---|---|---|
| 2019 | 98,171 | +45,806 | 46,447 | — | Pre-AU; strong enrollment |
| 2020 | 149,712 | +51,541 | 60,514 | +30% | AU launched; both rising |
| 2021 | 181,517 | +31,805 | 68,320 | +13% | Peak active patients (70,600 Jul) |
| 2022 | 254,858 | +73,341 | 64,855 | -5% | Active begins declining |
| 2023 | 307,187 | +52,329 | 63,530 | -2% | Slow attrition continues |
| 2024 | 356,561 | +49,374 | 60,558 | -5% | Acceleration in decline |
| 2025 | 400,673 | +44,112 | 53,975 | -11% | Sharpest single-year drop |
| 2026† | 412,832 | +12,159 | ~49,092 | — | Partial; through Mar/Feb 2026 |
† 2026 MCPP data through March 31, 2026. Active patient data through February 2026.
Dispensary Expansion and the Licensing Pipeline
Illinois entered adult use with 55 medical dispensaries that were immediately authorized to serve recreational customers. A "second site" provision allowed each to open one additional location, bringing the effective adult use retail footprint to 110 stores in January 2020. The subsequent expansion has been deliberate but contested: the Cannabis Regulation and Tax Act authorized up to 500 total dispensary licenses, but lottery processes, legal challenges, and social equity requirements slowed new entrants significantly through 2023.
By February 2026, Illinois had reached 277 active dispensaries per IDFPR's published license list — growing to 284 by April 2026 per Emerald Intel tracking. The CRTA authorized up to 500 total dispensary licenses; the gap between that ceiling and the current active count reflects a mix of licenses that have been awarded but are not yet operational, conditional licenses still working through the conversion process, and licenses not yet issued. The full pipeline breakdown is not available from IDFPR's published active license list. The dispensary count tells a story of controlled expansion — Illinois has grown retail access meaningfully without the rapid over-build seen in some Western markets.
A key structural feature of the Illinois market is the ownership cap embedded in the CRTA (410 ILCS 705/15-15): no single person or entity may hold more than 10 dispensary licenses. This provision was deliberately designed to prevent large multistate operators from dominating the retail landscape and crowding out smaller, locally-owned applicants — particularly social equity licensees. In practice, the cap has shaped the market's competitive structure: operators like Green Thumb Industries, Cresco Labs, and Verano each operate close to the 10-location ceiling, while the majority of the 284 active licenses are held by single-location or small-format operators. The cap does not restrict management agreements, licensing deals, or branding arrangements — creating a secondary layer of operator consolidation through non-ownership structures that the 10-license limit does not reach.
| Period | Est. Active Dispensaries | AU Monthly Avg Rev | Est. Rev/Dispensary/Mo | Note |
|---|---|---|---|---|
| Jan 2020 | 55 | $39.2M | $713K | 55 medical dispensaries, day-one AU |
| Dec 2020 | ~80 | $86.9M | $1.09M | Second-site expansion underway |
| Dec 2021 | ~110 | $137.9M | $1.25M | Peak revenue-per-location period |
| Dec 2022 | ~130 | $143.9M | $1.11M | New licenses slowly entering |
| Dec 2023 | ~160 | $153.9M | $962K | Lottery winners opening |
| Dec 2024 | ~240 | $153.2M | $638K | Continued expansion; AU plateauing |
| Feb 2026 | 277 | $118.0M | $426K | IDFPR confirmed; 284 by Apr 2026 |
The revenue-per-dispensary trend captures Illinois's unit economics challenge in a single figure. In 2021, each location averaged roughly $1.25M per month in adult use revenue. By early 2026, with 277 active dispensaries and monthly adult use revenue of approximately $108–118M, the per-location average has fallen to roughly $400–430K — a decline of more than 65% from peak. This compression reflects three simultaneous forces: more locations sharing a market that has stopped growing, price deflation reducing per-transaction values, and the ongoing shift of consumer spend toward value-tier products.
Product Mix and Revenue Composition
Illinois product-level sales data is available for the adult use channel from mid-2025 through early 2026, covering three reported categories: Buds (flower), Concentrate, and Infused Edible. This partial window provides a snapshot of the current market's composition but does not allow for the long-run trend analysis available in Ohio's dataset.
The adult use product mix in Illinois skews heavily toward flower and concentrates, with edibles a distant third. Buds (flower) represent approximately 54% of revenue, concentrates 32%, and infused edibles 14% based on the available nine-month window. Illinois's concentrate share (32%) is notably higher than is typically seen in newer adult use markets, where edibles and flower tend to dominate early adoption. The data does not support drawing conclusions about why this is the case — longer product history, pricing dynamics, or local consumer preference could each be contributing factors.
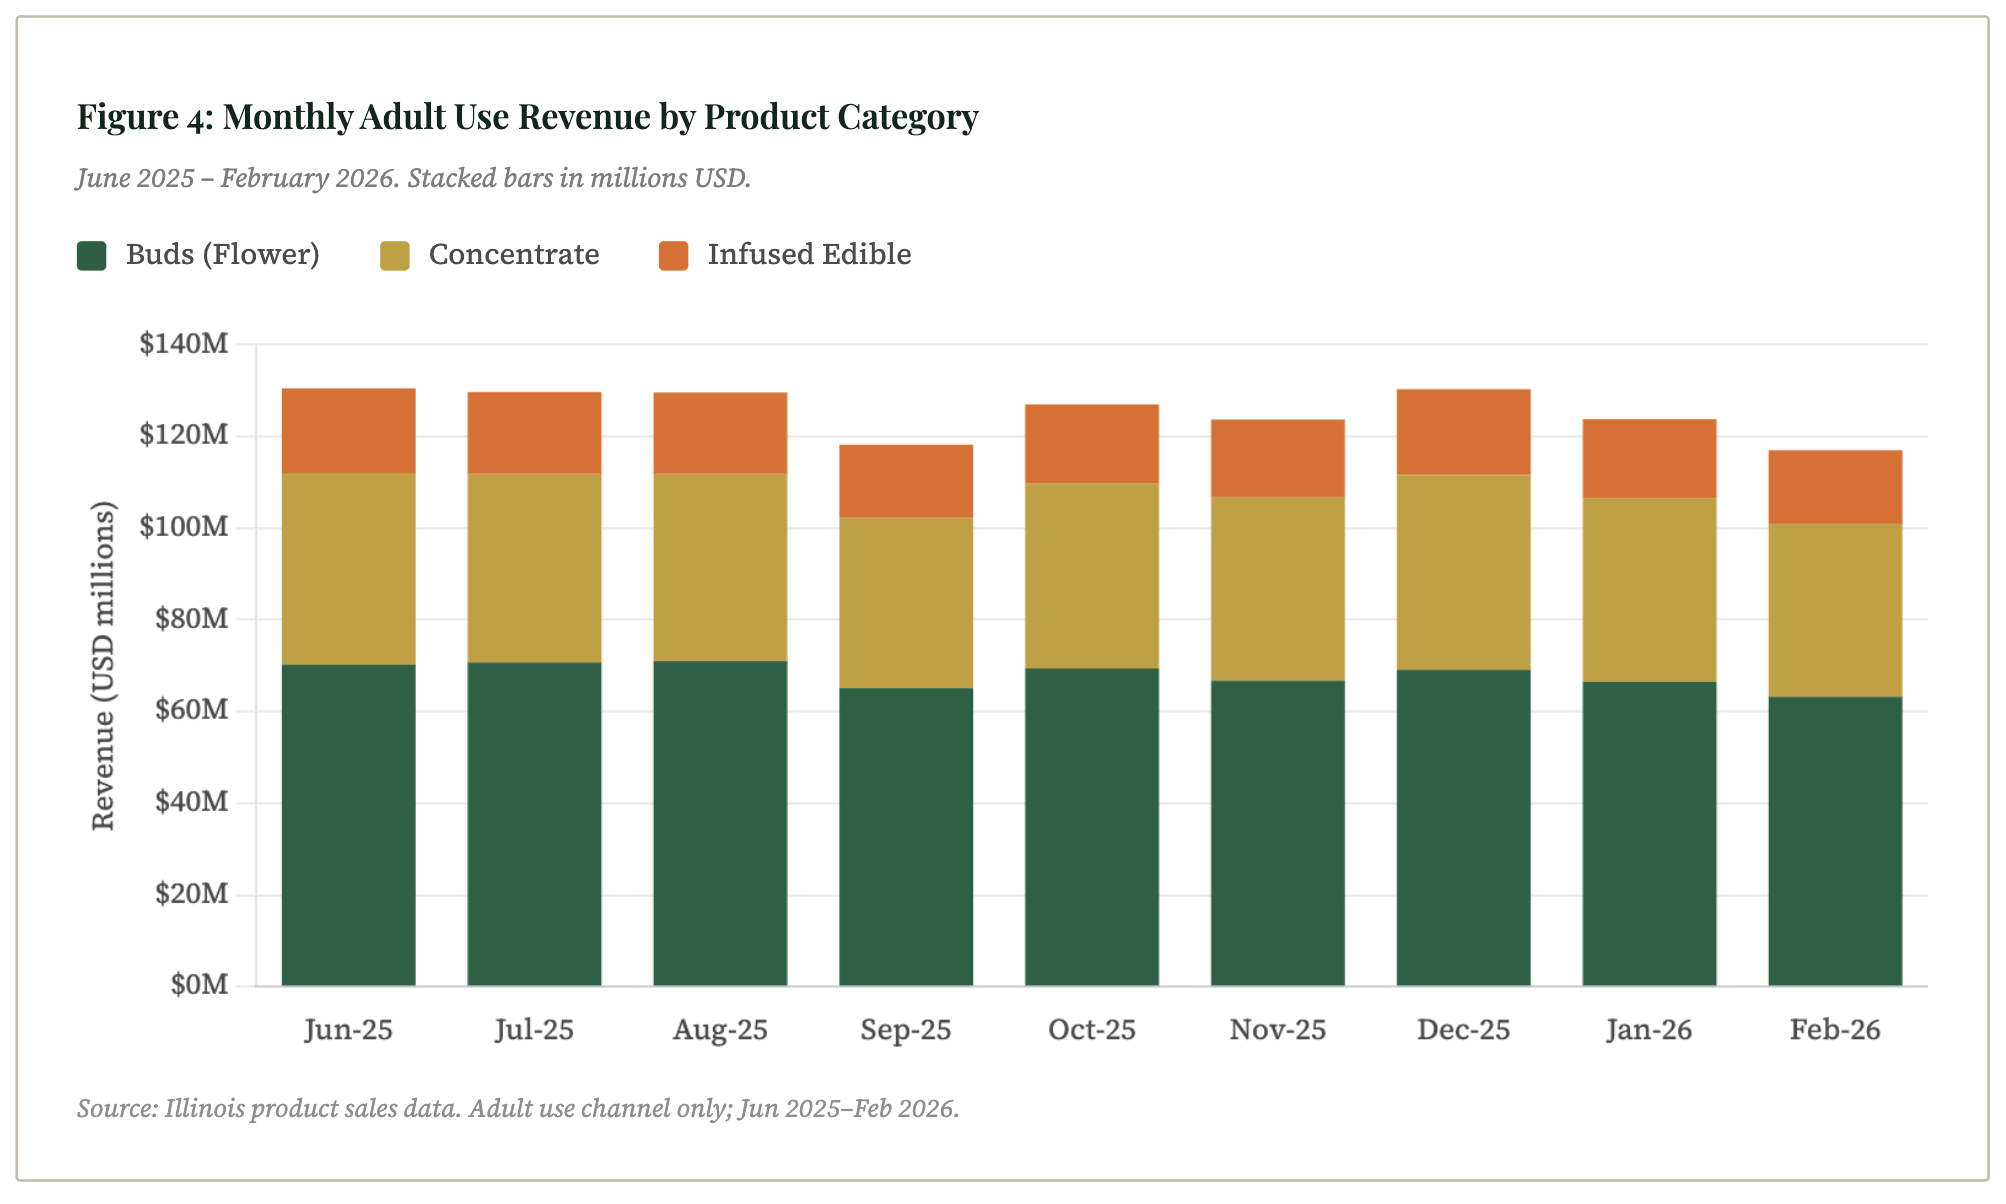
| Month | Buds | Concentrate | Infused Edible | Total | Buds % | Conc. % | Edible % |
|---|---|---|---|---|---|---|---|
| Jun 2025 | $70.2M | $41.8M | $18.5M | $130.5M | 53.8% | 32.0% | 14.2% |
| Jul 2025 | $70.7M | $41.1M | $17.9M | $129.7M | 54.5% | 31.7% | 13.8% |
| Aug 2025 | $71.0M | $40.8M | $17.8M | $129.7M | 54.8% | 31.5% | 13.7% |
| Sep 2025 | $65.1M | $37.2M | $15.9M | $118.2M | 55.1% | 31.5% | 13.4% |
| Oct 2025 | $69.4M | $40.4M | $17.2M | $127.0M | 54.6% | 31.8% | 13.5% |
| Nov 2025 | $66.7M | $40.0M | $17.0M | $123.7M | 53.9% | 32.3% | 13.8% |
| Dec 2025 | $69.1M | $42.5M | $18.7M | $130.3M | 53.0% | 32.6% | 14.4% |
| Jan 2026 | $66.5M | $40.1M | $17.2M | $123.8M | 53.7% | 32.4% | 13.9% |
| Feb 2026 | $63.2M | $37.6M | $16.2M | $117.1M | 54.0% | 32.1% | 13.8% |
| Avg share | — | — | — | — | 54.2% | 32.0% | 13.8% |
The category shares are remarkably stable across this nine-month window — flower holding between 53–55%, concentrate between 31–33%, and edibles between 13–15%. This stability suggests the Illinois adult use market has reached product-mix equilibrium; format preferences are entrenched and unlikely to shift materially absent a new product category or significant price disruption in one segment.
Conclusions: What the Illinois Data Tells Us
Illinois built a top-five state cannabis market in five years
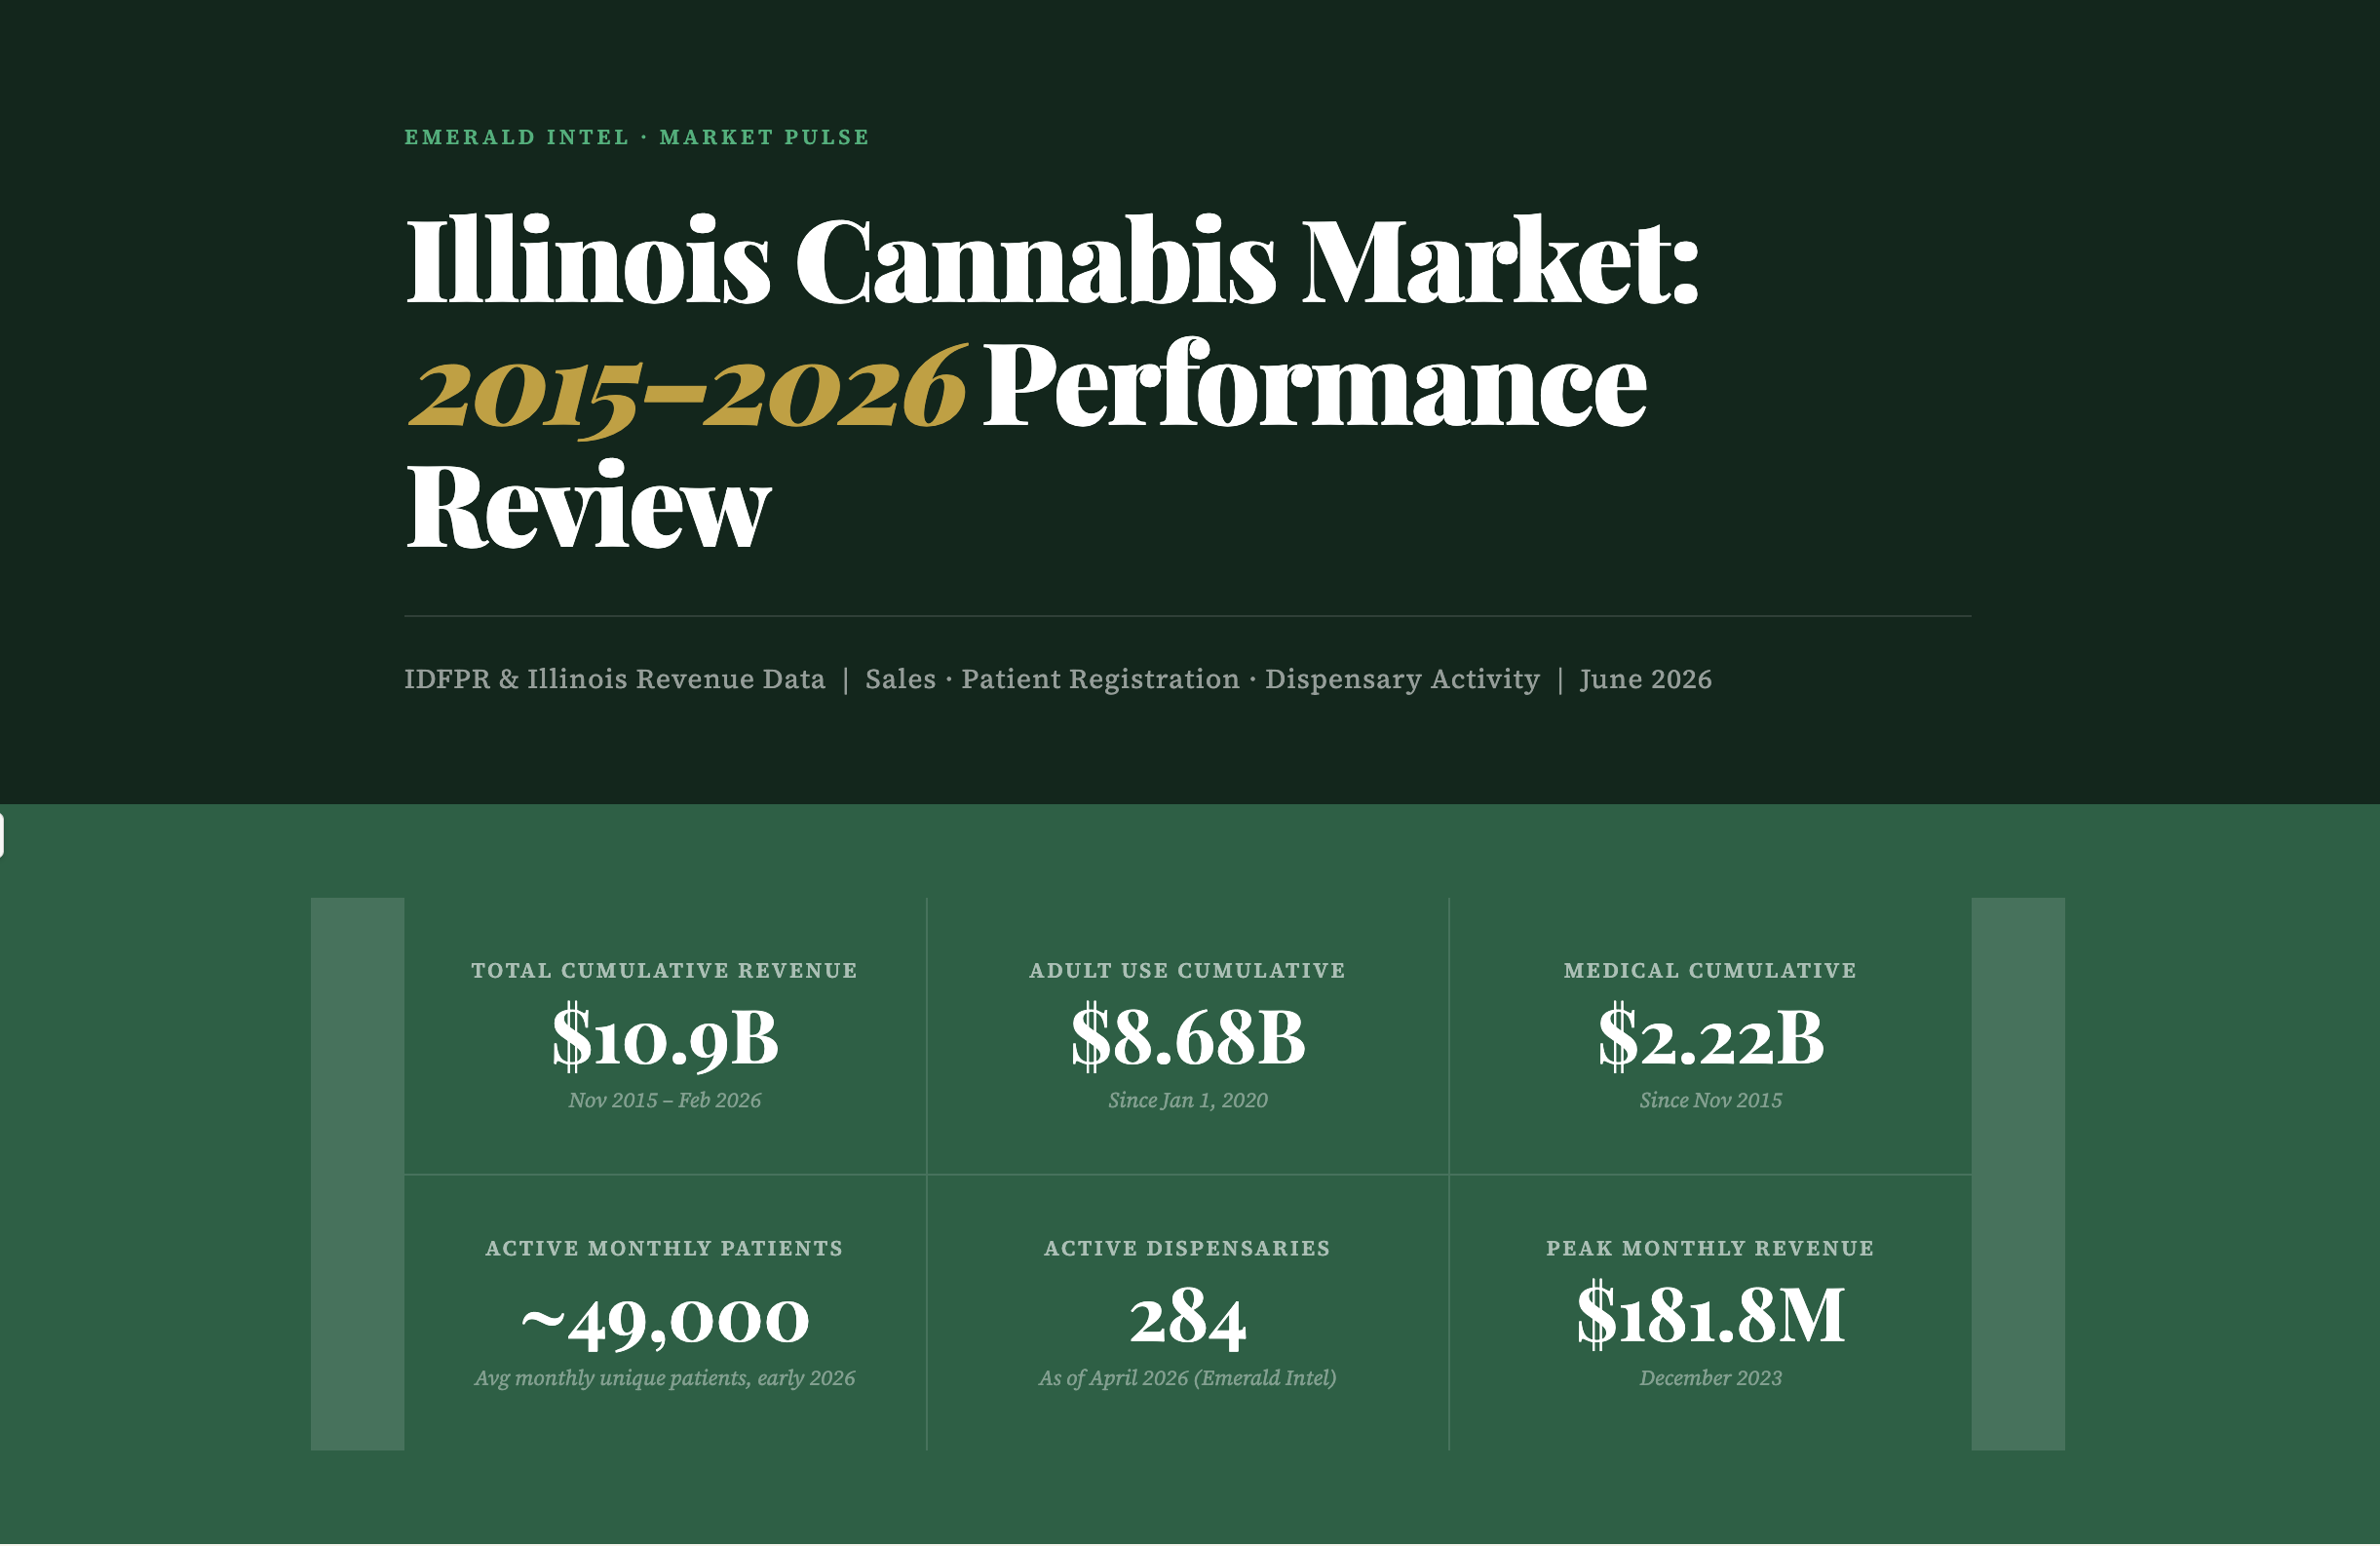
$10.9B in cumulative sales since 2015, crossing $2B in annual total revenue by 2024. Adult use legalization on January 1, 2020 was executed cleanly: existing medical dispensaries converted immediately, producing $669M in adult use revenue in year one. That operational execution — no new license lottery required to open, no delay between legalization and retail sales — distinguished Illinois from peer markets.
The market has entered a correction phase — structural, not cyclical
2025 marked the first year of total market contraction: adult use revenue fell 12.5% and medical fell 27% year-over-year. Monthly total revenue in early 2026 is running at approximately $121M — down from a peak monthly average of $167M in 2024. Price compression is the primary mechanical driver, compounded by a saturating consumer base and a growing store count dividing a smaller revenue pie.
Medical's decline is gradual and structural, not catastrophic
Illinois's medical program has been contracting since 2022 — four years of sustained decline rather than a single cliff-edge event. Medical revenue is now approximately 11% of the total market and falling. Active unique patients served have dropped 30% from the 2021 peak. The remaining medical base is likely anchored by patients with genuine therapeutic need, higher purchase limits, or tax considerations — not convenience registrants who have migrated to adult use.
Dispensary economics are compressing meaningfully
Revenue per active dispensary per month has declined from approximately $1.25M at peak in late 2021 to roughly $400–430K in early 2026 — a reduction of more than 65%. Illinois continues adding locations into a flat-to-declining revenue environment. The CRTA's 500-license ceiling leaves meaningful room for further retail expansion, and the pace of conditional license conversions will determine how quickly that pressure materializes. The CRTA's 10-license-per-entity ownership cap has distributed this pressure broadly across small operators rather than concentrating it among a few large chains — but smaller operators generally have less financial resilience to weather sustained margin compression.
The MCPP approval count overstates the active patient base significantly
Cumulative MCPP approvals (412,832) and monthly active patients served (~49,000) differ by nearly 8:1. The medical program is far smaller in practice than headline enrollment figures suggest. Policy and market analyses that use cumulative approval counts to estimate patient demand should be treated with caution.
Product mix is stable; prices are not
Flower (~54%), concentrate (~32%), and edibles (~14%) have held remarkably stable shares over the available nine-month window. Price-per-unit data is available for both channels back to 2016 for medical and 2020 for adult use — and tells a significant story: medical concentrate prices fell from a ~$90 peak in early 2019 to ~$35 by late 2025, a compression of more than 60%. Adult use pricing shows a similar trajectory across all categories. This pricing data warrants a dedicated analysis in a subsequent report..
Developments to Watch
The following represent structural forces whose resolution will materially shape Illinois's cannabis market over the next two to four years. These are not predictions.
Adult Use Revenue Recovery vs. Continued Contraction
Illinois adult use revenue peaked at $143.6M/month in 2024 and has declined to approximately $108M/month in early 2026. The trajectory in 2026 will clarify whether this is a temporary correction or the beginning of a sustained contraction similar to what Colorado and Oregon experienced after their respective peaks.
Two countervailing forces are in play: further dispensary openings will divide revenue across more locations, while any recovery in consumer spending or price stabilization could reverse the top-line decline. The licensing pause announced in June 2025 may moderate the pace of new-location competition.
- → Monthly adult use revenue trajectory through Q3–Q4 2026
- → New dispensary openings relative to the 500-license cap and the pace of conditional license conversions
- → Any IDFPR data on per-transaction average values as a price compression proxy
Federal Rescheduling and 280E Relief
The DEA's proposed reclassification of cannabis from Schedule I to Schedule III remains in process. For Illinois operators — many of whom carry high debt loads from competitive license processes and capital-intensive buildouts — relief from IRS Section 280E would be transformative. Effective tax rates under 280E have run 60–80% for some plant-touching businesses; Schedule III removes that classification and could dramatically improve dispensary profitability without any change in revenue.
For the medical program specifically, rescheduling opens pathways for VA physician engagement with veterans — a significant currently-excluded patient population in Illinois, home to one of the largest veteran communities in the Midwest.
- → Final DEA rulemaking timeline and any federal court challenges
- → IRS guidance on 280E applicability post-rescheduling
- → Whether Illinois medical patient registrations stabilize or grow following federal legitimization
- → Banking access improvements for Illinois operators currently relying on cash-heavy operations
Social Equity Program Outcomes and Market Concentration
Illinois's social equity licensing program — including lotteries that awarded licenses to applicants from disproportionately impacted areas — is one of the most ambitious in the country. Of active dispensing organizations, 151 are majority-owned by Social Equity Applicants (per IDFPR FY2025 data). Whether these operators can achieve financial sustainability in a compressed-margin environment is an open question. Many entered the market later, into a more competitive landscape, and with less access to capital than incumbents.
If a wave of social equity licensees cannot sustain operations, market concentration could increase as larger MSOs or well-capitalized independents acquire or absorb struggling locations — a pattern seen in other mature state markets.
- → License transfer and acquisition activity, particularly involving social equity-held licenses
- → Whether the CRTA's 10-license ownership cap comes under legislative pressure as operators seek scale
- → IDFPR enforcement actions or voluntary surrenders of dispensary licenses
- → Legislative responses to social equity operator financial distress
- → Whether the licensing pause announced in June 2025 extends or is lifted
Medical Program Stabilization or Continued Attrition
Illinois medical monthly revenue has fallen from $33.1M in 2021 to $13.0M in early 2026 — a 61% decline in absolute terms. At current trajectory, the medical program represents a shrinking but durable niche: the roughly 49,000 active monthly patients likely include a core of high-frequency, high-spend users for whom the program's structural benefits (higher purchase limits, lower effective tax rate, access to higher-potency formulations in some categories) outweigh the cost of maintaining a medical card.
Whether this core stabilizes or continues to erode depends partly on whether the adult use channel converges on comparable purchase limits and pricing, and partly on whether federal rescheduling creates new reasons to engage with the medical program.
- → Monthly unique patients served — any stabilization below 45,000 would signal a durable floor
- → Illinois legislative proposals affecting medical cannabis tax treatment relative to adult use
- → MCPP renewal rates as the patient cohort from 2020–2022 reaches multi-year renewal thresholds
- → Whether post-rescheduling veteran access programs drive a measurable uptick in new MCPP registrations
Data Sources and Methodology
- Sales data (Medical & Adult Use, 2019–2026): Emerald Intel Illinois Sales by Date and Program export. Monthly figures by channel through February 2026. Adult use channel begins January 2020 (Illinois legalization date).
- Retail sales data (supplemental): IDFPR Illinois retail sales CSV (Medical Sales and Adult Use Sales channels; Nov 2015–Feb 2026). Used for early-year medical history and cross-validation.
- Patient data (active monthly): IDFPR Illinois monthly unique patients served at dispensaries, November 2015–February 2026.
- MCPP approved patients: Illinois Medical Cannabis Patient Program approved qualifying patients archive, extracted from MCPP monthly update pages. 144 indexed report entries; 135 extracted observations. Latest indexed report: March 31, 2026.
- Product category data: Illinois adult use product revenue by category (Buds, Concentrate, Infused Edible), June 2025–February 2026. Adult use channel only.
- Dispensary count: IDFPR Active Adult Use Dispensing Organization License list (published monthly at idfpr.illinois.gov; version updated February 20, 2026 shows 277 active licenses). Emerald Intel tracking shows 284 active through April 2026.
- License pipeline: Cannabis Regulation and Tax Act, 410 ILCS 705/15-15 (500-license cap). Active dispensary count sourced from IDFPR license list (277 active as of February 20, 2026). The breakdown between licenses not yet issued, conditionally awarded, and awarded but not yet operational is not available from IDFPR's published data; secondary sources consulted (Cannabis Industry Lawyer, GrowerIQ) vary in their figures and are law firm marketing content rather than primary regulatory data.
- Social equity ownership data: IDFPR Annual Cannabis Report FY2025 (via Mood Shine analysis, January 2026). 151 dispensing organization licenses majority-owned by Social Equity Applicants.
- Dispensary ownership cap: Cannabis Regulation and Tax Act, 410 ILCS 705/15-15.
- 2026 data partial through February 2026. All figures in USD. Revenue figures rounded to nearest $100K.